Click to enlarge
| Domestic Operating Sites: 27 | Overseas Operating Sites: 16 |
|---|---|
|
Hitachi Works of JX Metals Corporation (including Technology Development Center, Hitachi Works of JX Metals Smelting Co., Ltd., and JX Metals Environmental Services Co., Ltd.) |
JX Nippon Mining & Metals Philippines, Inc. |
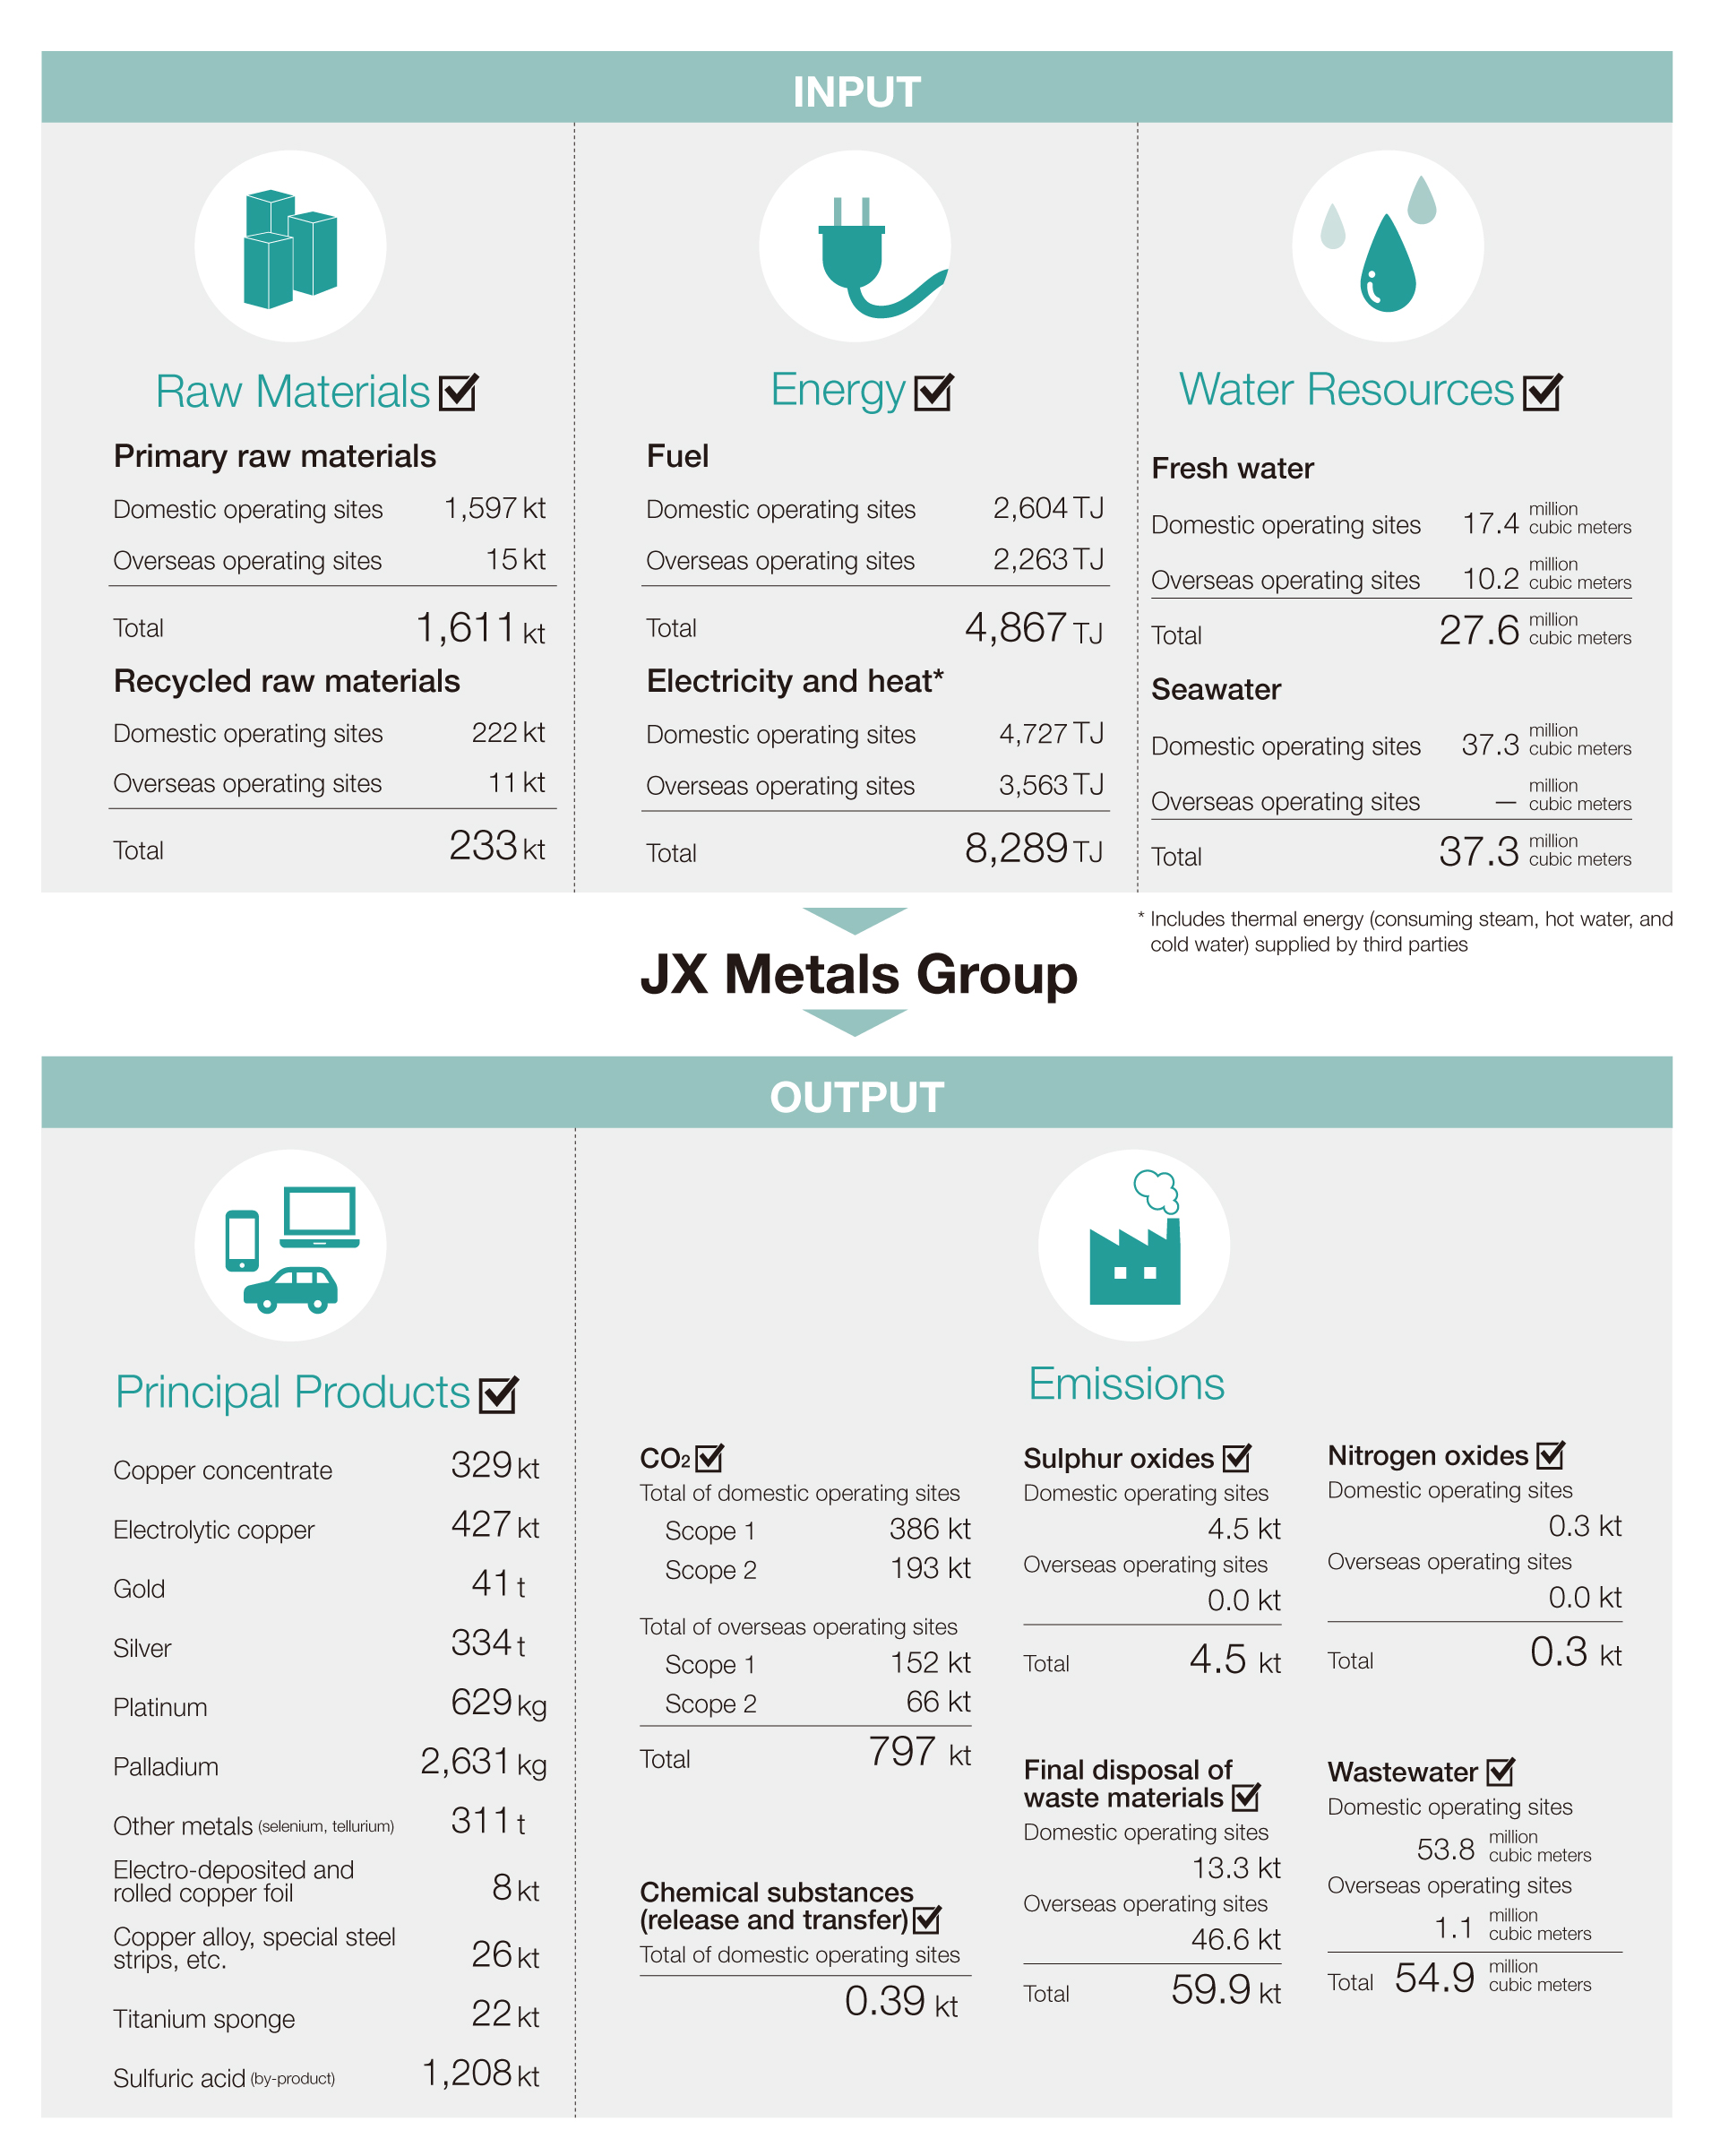
Ratio of recycled raw materials in incoming raw materials for the copper smelting business
14.9%
Ratio of copper from recycled raw materials in electrolytic copper
24.8%
(1) Ratio of recycled raw materials in incoming raw materials for the copper smelting business)
(total dry volume of recycled raw materials processed at JX Metals Smelting Co., Ltd.*1) ÷ (total dry volume of primary and recycled raw materials processed at JX Metals Smelting Co., Ltd.) x 100 (Unit: %)
(2) Ratio of copper from recycled raw materials in electrolytic copper
(amount of copper derived from recycled raw materials in copper anodes per year*2) ÷ (copper anode charge per year)
| Domestic Operating Sites | Overseas Operating Sites | |
|---|---|---|
| Kerosene (kL) | 127 | 0 |
| Gasoline (kL) | 130 | 153 |
| Light oil (kL) | 2,940 | 55,260 |
| Class A heavy oil (kL) | 7,895 | 0 |
| Class B and C heavy oil (kL) | 14,847 | 0 |
| Reclaimed oil (kL) | 2,664 | 0 |
| LPG/Butane (t) | 5,657 | 40 |
| LNG (t) | 3,880 | 683 |
| Coke (t) | 1,311 | 0 |
| Petroleum coke (t) | 4,326 | 0 |
| City gas (thousand cubic meters) | 17,291 | 3,018 |
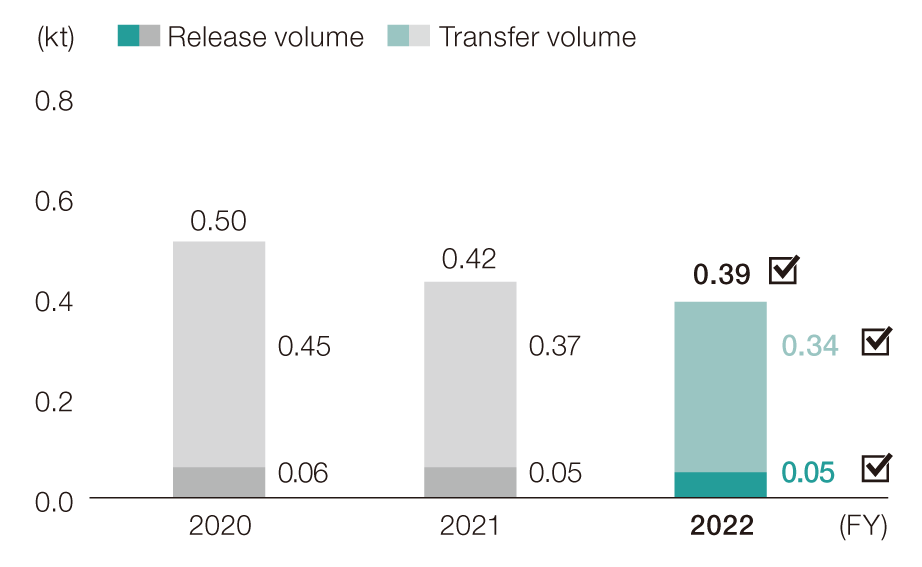
| No. | Cabinet Order No. | Chemical Substance | Release Volume | Transfer Volume | |||
|---|---|---|---|---|---|---|---|
| Air | Water | On-site Landfill Disposal | Sewage Systems | Waste Materials | |||
| 1 | 31 | Antimony and its compounds | 0.1 | 0.6 | 0.0 | 0.0 | 6.5 |
| 2 | 75 | Cadmium and its compounds | 0.1 | 0.1 | 0.0 | 0.0 | 13.4 |
| 3 | 132 | Cobalt and its compounds | 0.0 | 0.2 | 0.0 | 0.0 | 9.1 |
| 4 | 272 | Copper salts (water soluble) | 0.3 | 1.6 | 0.0 | 0.0 | 7.0 |
| 5 | 300 | Toluene | 35.1 | 0.0 | 0.0 | 0.2 | 235.0 |
| 6 | 305 | Lead compounds | 0.8 | 0.1 | 0.0 | 0.0 | 47.8 |
| 7 | 309 | Nickel compounds | 0.1 | 0.4 | 0.0 | 0.0 | 8.9 |
| 8 | 405 | Boron compounds | 0.0 | 5.4 | 0.0 | 0.0 | 1.5 |
| 9 | 243 | Dioxins | 0.1 | 0.0 | 0.0 | 0.0 | 2.9 |
| Category | 2020 | 2021 | 2022 | |||
|---|---|---|---|---|---|---|
| Safety performance at domestic operating sites | Employees (including Group companies) | Casualties of occupational accidents | Fatalities (persons)*3 | 0 | 0 | 0 |
| Occupational accidents with severe consequences (persons)*3 | 0 | 0 | 0 | |||
| Accidents with lost work days (persons)*3 | 7 | 10 | 3 | |||
| Accidents without lost work days (persons)*3 | 13 | 24 | 27 | |||
| Total (persons) | 20 | 34 | 30 | |||
| Major types of occupational accidents*4 | Strain or overexertion (persons) | 5 | 6 | 2 | ||
| Falls on same level (persons) | 1 | 3 | 4 | |||
| Caught in, on, or between machinery (persons) | 3 | 1 | 7 | |||
| Frequency rate of occupational accidents*5 | Fatalities*3 | 0.00 | 0.00 | 0.00 | ||
| Occupational accidents with severe consequences*3 | 0.00 | 0.00 | 0.00 | |||
| Accidents with lost work days*3 | 0.53 | 0.74 | 0.21 | |||
| Severity rate of occupational accidents*5 | 0.03 | 0.03 | 0.01 | |||
| Cumulative work hours*5 | 13,290,060 | 13,442,362 | 14,365,459 | |||
| Employees of subcontractors*6 | Casualties of occupational accidents*4 | Fatalities (persons) | 2 | 0 | 0 | |
| Occupational accidents with severe consequences (persons) | 0 | 0 | 0 | |||
| Accidents with lost work days (persons) | 2 | 6 | 4 | |||
| Accidents without lost work days (persons) | 6 | 13 | 13 | |||
| Total (persons) | 10 | 19 | 17 | |||
| Major types of occupational accidents*4 | Cut or abrasions (persons) | 4 | 4 | 1 | ||
| Crashes or falls to lower level (persons) | 2 | 2 | 2 | |||
| Struck by object (persons) | 0 | 0 | 1 | |||
| Frequency rate of occupational accidents *5,6 | Fatalities*3 | 0.64 | 0.00 | 0 | ||
| Occupational accidents with severe consequences*3 | 0.00 | 0.00 | 0 | |||
| Accidents with lost work days*3 | 0.64 | 1.94 | 1.47 | |||
| Severity rate of occupational accidents *5,6 | 4.82 | 0.11 | 0.04 | |||
| Cumulative work hours *6 | 3,117,548 | 3,090,280 | 2,726,924 | |||
| Total casualties (persons) | 30 | 53 | 47 | |||
| Occupational injury rate per 1,000 employees (four or more lost workdays)*7 | 1.1 | 1.7 | 0.74 | |||
| Explosions and fires (incidences)*8 | 1 | 0 | 2 | |||
| (Reference)Safety performance at overseas operating sites*9 | Fatalities (persons) | 0 | 0 | 0 | ||
| Accidents with lost work days (persons) | 13 | 19 | 17 | |||
| Accidents without lost work days (persons) | 5 | 7 | 5 | |||
| Total (persons) | 18 | 26 | 22 | |||
| Major types of occupational accidents | Caught in, on, or between machinery (persons) | 3 | 8 | 3 | ||
| Falls on same level (persons) | 5 | 4 | 1 | |||
| Strain or overexertion (persons) | 3 | 3 | 1 | |||
| Managerial Staff | Non-Management Employees | Total | |||||||
|---|---|---|---|---|---|---|---|---|---|
| Male | Female | Total | Male | Female | Total | Male | Female | Total | |
| Total annual program hours (hours) | 9,486 | 379 | 9,865 | 62,507 | 11,530 | 74,036 | 71,993 | 11,909 | 83,902 |
| Program hours per employee (hours/person) | 22 | 9 | 21 | 57 | 24 | 47 | 47 | 23 | 41 |
Survey scope: Companies in which JX Metals has 50% or more of their voting rights, directly or indirectly
Treatment of seconded employees: Employees seconded from companies outside of survey scope to companies inside of survey scope are counted.
Employees seconded from companies inside of survey scope to companies outside of survey scope are also counted.
(persons)
| Employment Status | Contract Type | Male | Female | Total |
|---|---|---|---|---|
| Full-time | Contracts without fixed terms | 8,449 | 1,383 | 9,832 |
| Contracts with fixed terms | 634 | 133 | 767 | |
| Full-time subtotal | 9,083 | 1,516 | 10,599 | |
| Part-time | Contracts without fixed terms | 31 | 47 | 78 |
| Contracts with fixed terms | 58 | 24 | 82 | |
| Part-time subtotal | 89 | 71 | 160 | |
| Total | 9,172 | 1,587 | 10,759 | |
(persons)
| Employment Status | Contract Type | Japan | North America | South America | Asia | Europe | Middle East | Total |
|---|---|---|---|---|---|---|---|---|
| Full-time | Contracts without fixed terms | 6,763 | 371 | 949 | 1,389 | 350 | 10 | 9,832 |
| Contracts with fixed terms | 567 | 1 | 93 | 70 | 36 | 0 | 767 | |
| Full-time subtotal | 7,330 | 372 | 1,042 | 1,459 | 386 | 10 | 10,599 | |
| Part-time | Contracts without fixed terms | 56 | 0 | 0 | 3 | 19 | 0 | 78 |
| Contracts with fixed terms | 79 | 0 | 0 | 1 | 2 | 0 | 82 | |
| Part-time subtotal | 135 | 0 | 0 | 4 | 21 | 0 | 160 | |
| Total | 7,465 | 372 | 1,042 | 1,463 | 407 | 10 | 10,759 | |
(persons)
| Japan | North America | South America | Asia | Europe | Middle East | Total | |
|---|---|---|---|---|---|---|---|
| Male | 6,575 | 270 | 947 | 1,033 | 337 | 10 | 9,172 |
| Female | 890 | 102 | 95 | 430 | 70 | 0 | 1,587 |
| Total | 7,465 | 372 | 1,042 | 1,463 | 407 | 10 | 10,759 |
| Male | Female | Total | |
|---|---|---|---|
| No. of new hires | 880 | 181 | 1,061 |
| Percent of total employee count as of March 31, 2023 | 10% | 11% | 10% |
| Age 29 or Younger | Age 30 to 49 | Age 50 or Older | Total |
|---|---|---|---|
| 408 | 520 | 133 | 1,061 |
| 26% | 8% | 5% | 10% |
| Japan | North America | South America | Asia | Europe | Middle East | Total | |
|---|---|---|---|---|---|---|---|
| No. of new hires | 672 | 100 | 206 | 71 | 12 | 0 | 1,061 |
| Percent of total employee count as of March 31, 2023 | 9% | 27% | 20% | 5% | 3% | 0% | 10% |
| Male | Female | Total | |
|---|---|---|---|
| No. of retiring employees | 575 | 129 | 704 |
| Percent of total employee count as of March 31, 2023 | 6% | 8% | 7% |
| Age 29 or Younger | Age 30 to 49 | Age 50 or Older | Total |
|---|---|---|---|
| 178 | 326 | 200 | 704 |
| 11% | 5% | 7% | 7% |
| Japan | North America | South America | Asia | Europe | Middle East | Total | |
|---|---|---|---|---|---|---|---|
| No. of retiring employees | 276 | 135 | 151 | 128 | 14 | 0 | 704 |
| Percent of total employee count as of March 31, 2023 | 4% | 36% | 14% | 9% | 3% | 0% | 7% |
| Male | Female | Total | |
|---|---|---|---|
| No. of union members | 5,690 | 889 | 6,579 |
| Unionization rate | 62% | 56% | 61% |
| Age 29 or Younger | Age 30 to 49 | Age 50 or Older | Total |
|---|---|---|---|
| 1,212 | 4,045 | 1,322 | 6,579 |
| 76% | 64% | 46% | 61% |
| Male | Female | Total | |
|---|---|---|---|
| No. of employees using leave | 22 | 10 | 32 |
| No. of employees eligible to use leave* | 122 | 10 | 132 |
| Percentage | 18% | 100% | 24% |
| Male | Female | Total | |
|---|---|---|---|
| No. of employees who returned to work from childcare leave during FY2021 | 17 | 12 | 29 |
| No. of employees still employed 12 months after returning to work | 15 | 12 | 27 |
| Percentage | 88% | 100% | 93% |
| Male | Female | Total | |
|---|---|---|---|
| No. of employees who returned to work from childcare leave during FY2022 | 22 | 16 | 38 |
| No. of employees scheduled to return to work | 22 | 16 | 38 |
| Percentage | 100% | 100% | 100% |
| No. of age-limited retirees | 62 |
| No. of these rehired | 54 |
| Percentage | 87% |
| Percentage of employees with disabilities (statutory minimum: 2.3%) | 2.10% |
| Number of Senior Managers | Senior Managers as a Share of Locally Hired Employees*1 | Number of Locally Hired Employees*2 | ||
|---|---|---|---|---|
| North America | Male | 40 | 15% | 270 |
| Female | 7 | 7% | 102 | |
| North America Total | 47 | 13% | 372 | |
| South America | Male | 65 | 7% | 947 |
| Female | 6 | 6% | 95 | |
| South America Total | 71 | 7% | 1,042 | |
| Europe | Male | 51 | 15% | 337 |
| Female | 8 | 11% | 70 | |
| Europe Total | 59 | 14% | 407 | |
| Asia | Male | 149 | 14% | 1,033 |
| Female | 67 | 16% | 430 | |
| Asia Total | 216 | 15% | 1,463 | |
| Total | 393 | 12% | 3,284 | |
Scope of aggregation: Overseas Group companies in which JX Metals has 50% or more of their voting rights, directly or indirectly.
Treatment of seconded employees: Employees seconded from companies outside of survey scope to companies inside of survey scope are counted.
Employees seconded from companies inside of survey scope to companies outside of survey scope are also counted.