
This and future reports include TANIOBIS GmbH, TANIOBIS Co. Ltd., TANIOBIS Smelting GmbH & Co. KG, and TANIOBIS USA LLC. However, TANIOBIS USA LLC is excluded from environmental data. The Hibi Smelter of Pan Pacific Copper Co., Ltd. was transferred to Mitsui Mining & Smelting Co., Ltd. on April 1, 2020, and is therefore not included in this report.
Click to enlarge
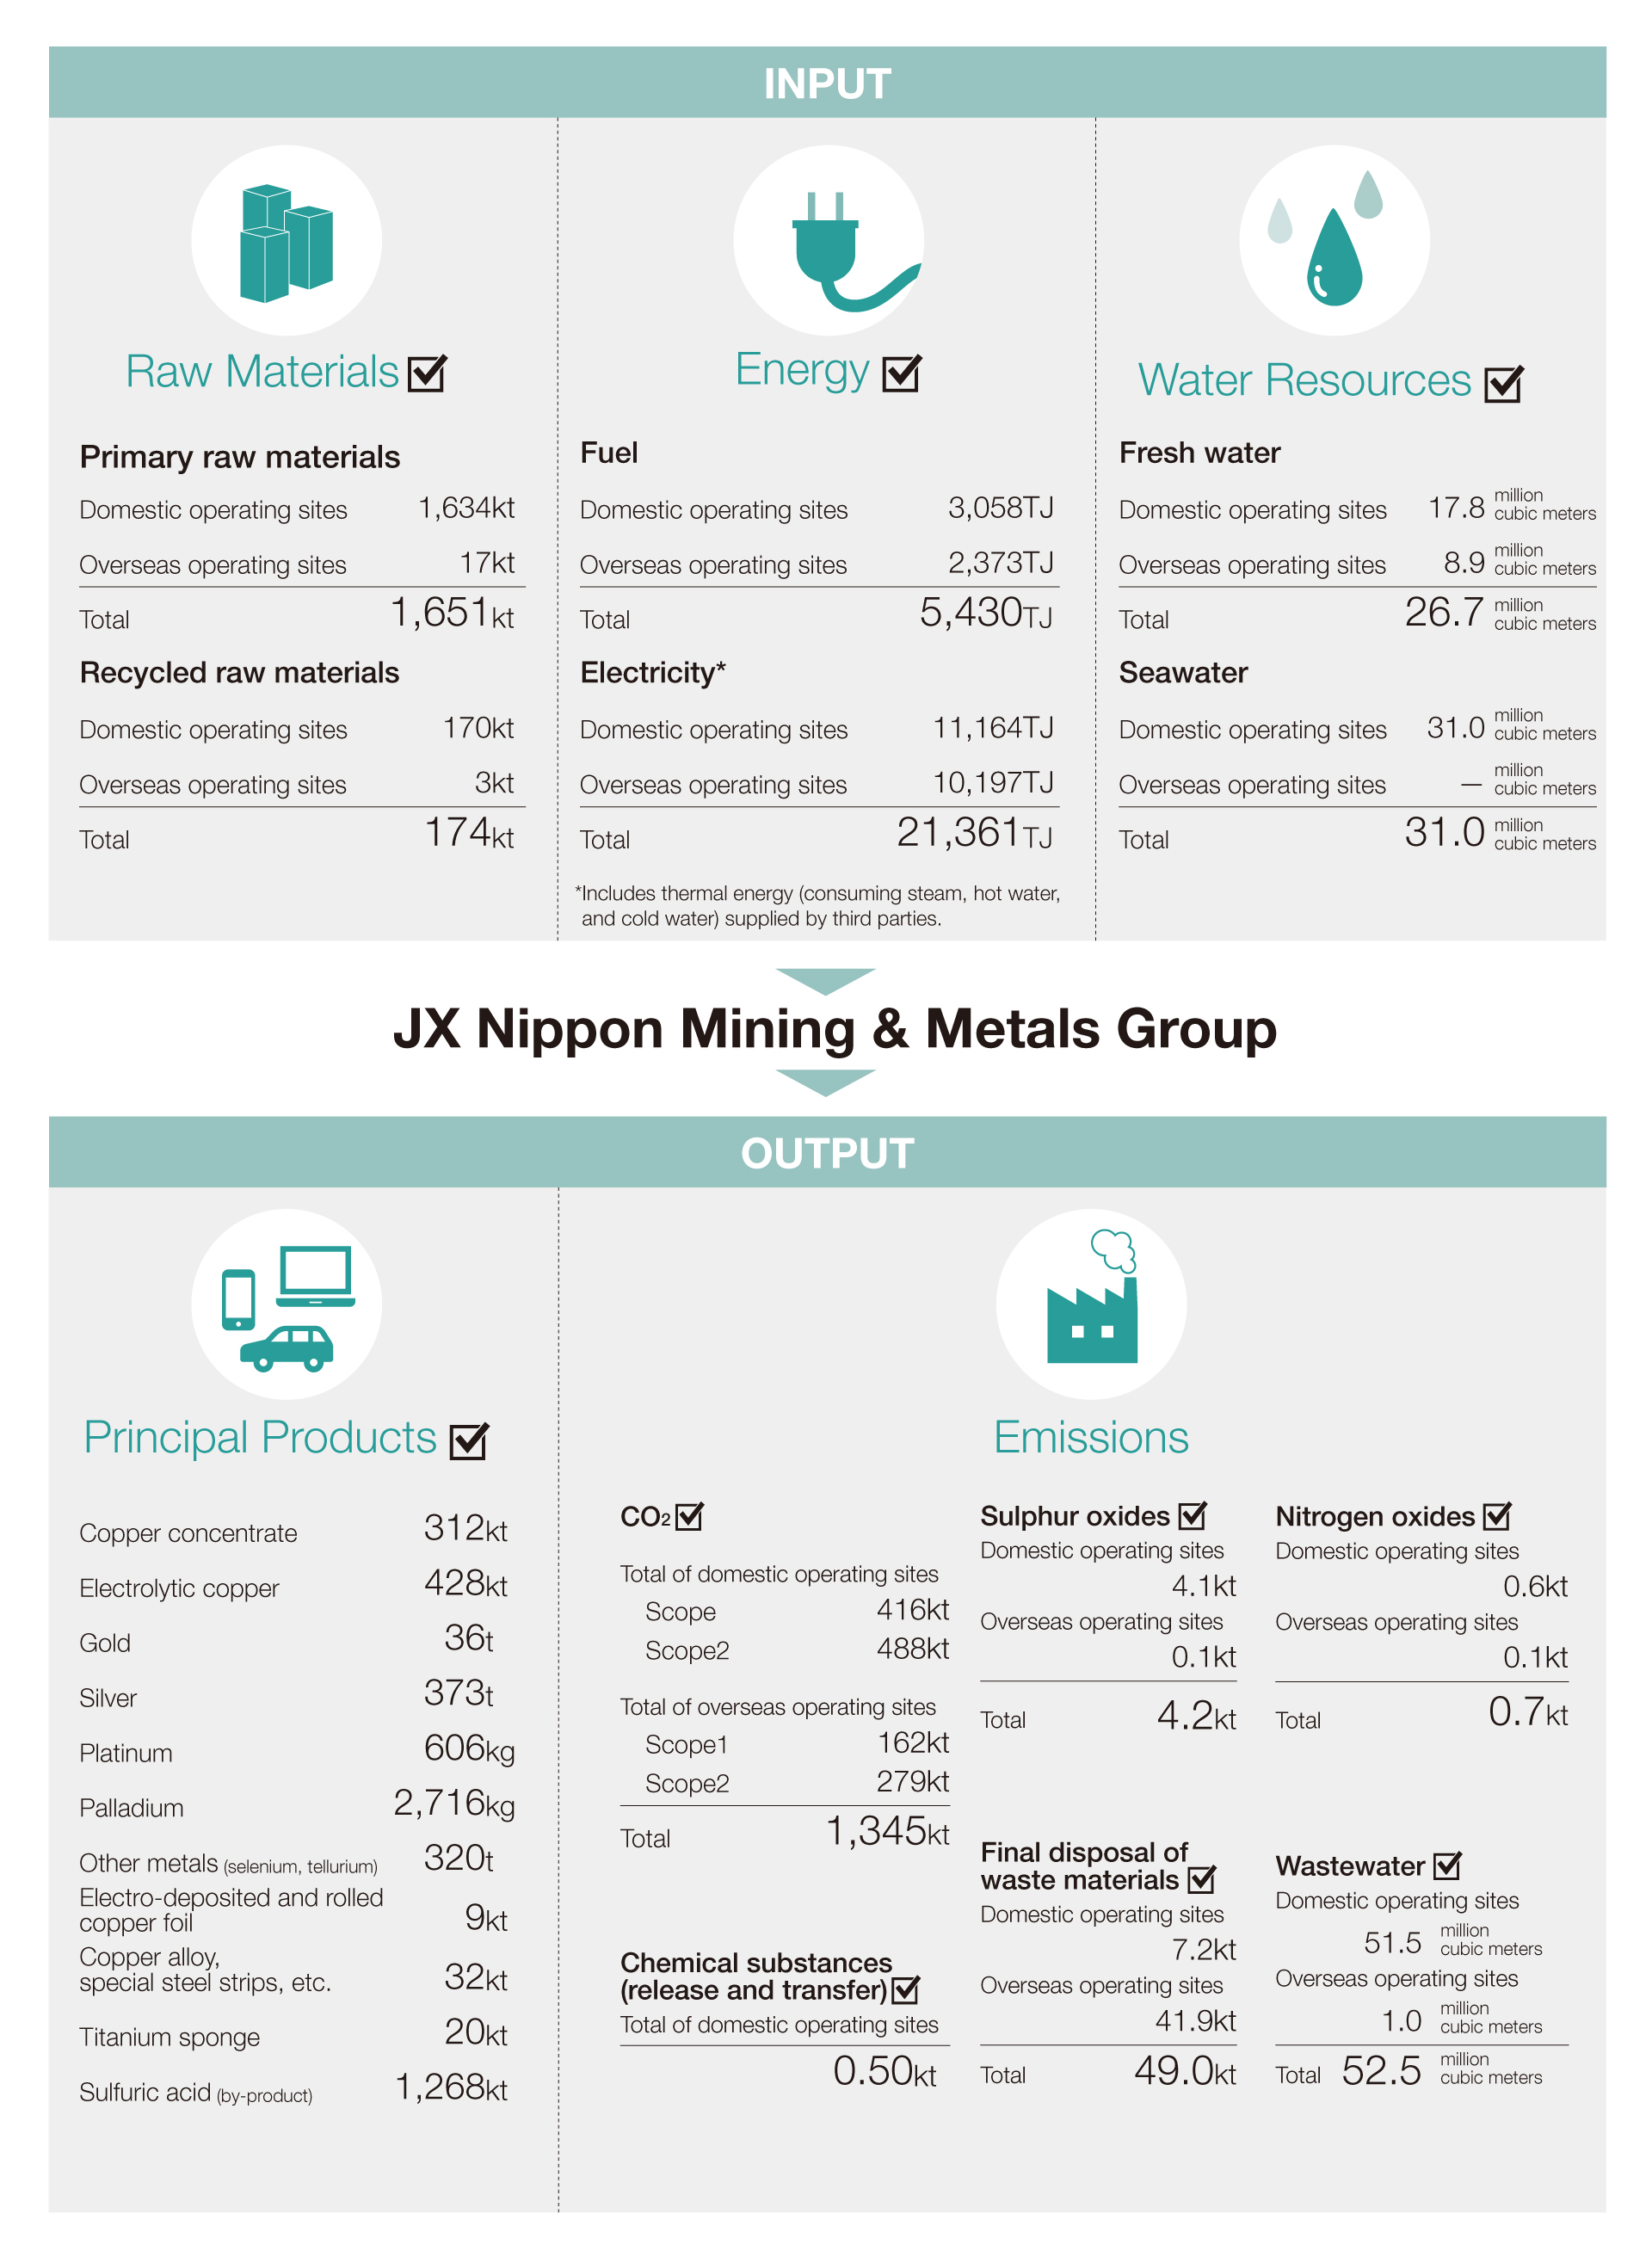
| Domestic Operating Sites: 28 | Overseas Operating Sites: 12 |
|---|---|
|
Hitachi Works (including Hitachi Seido Works of JX Metals Smelting Co., Ltd. |
JX Nippon Mining & Metals Philippines, Inc. |
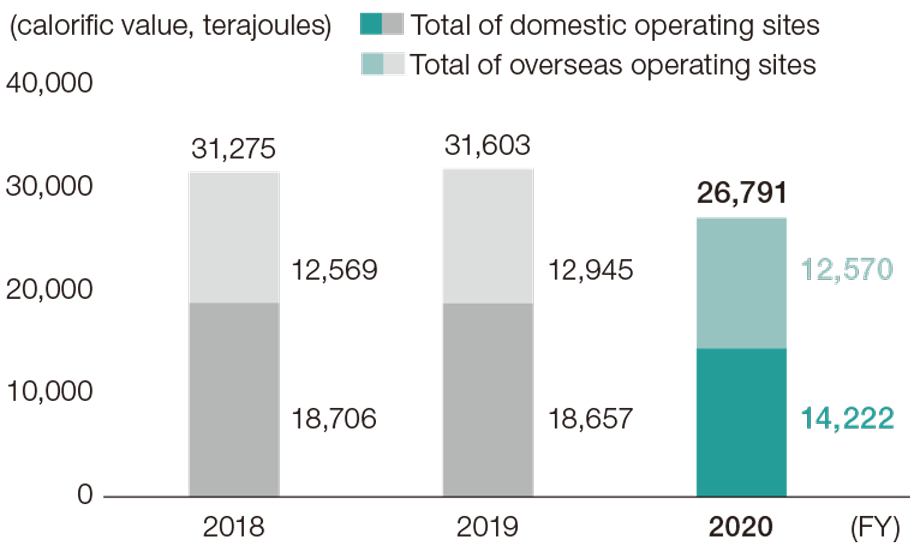
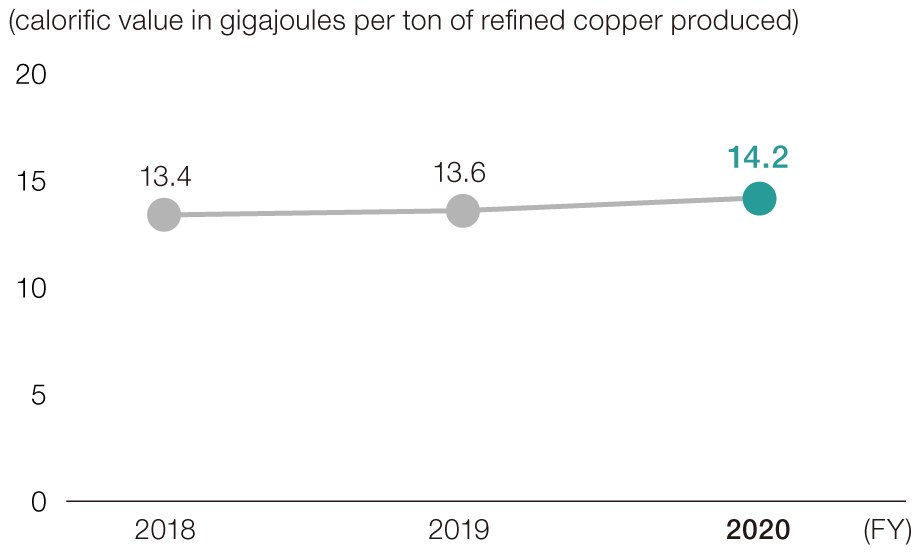
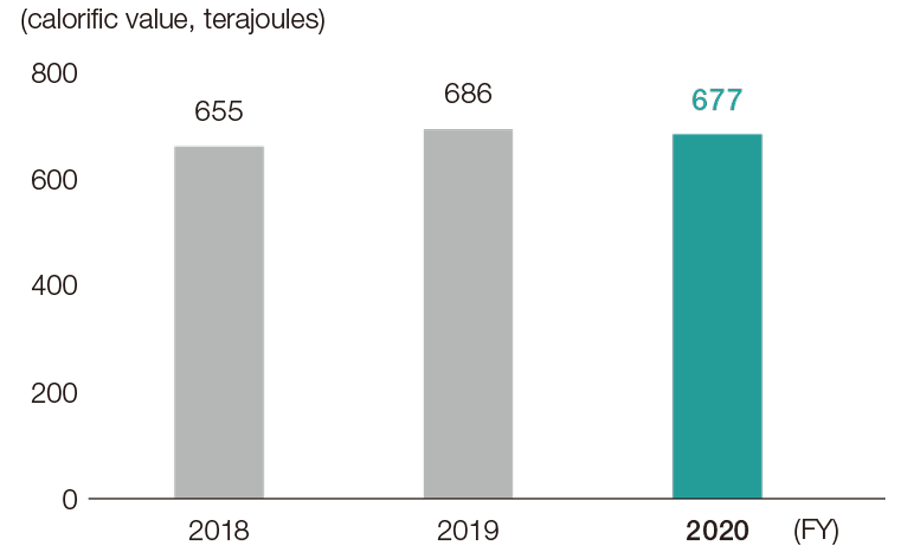
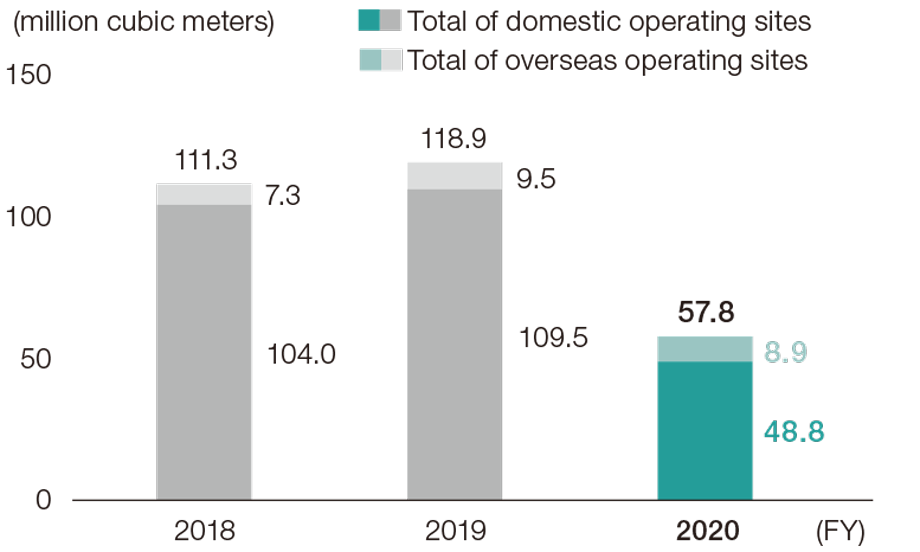
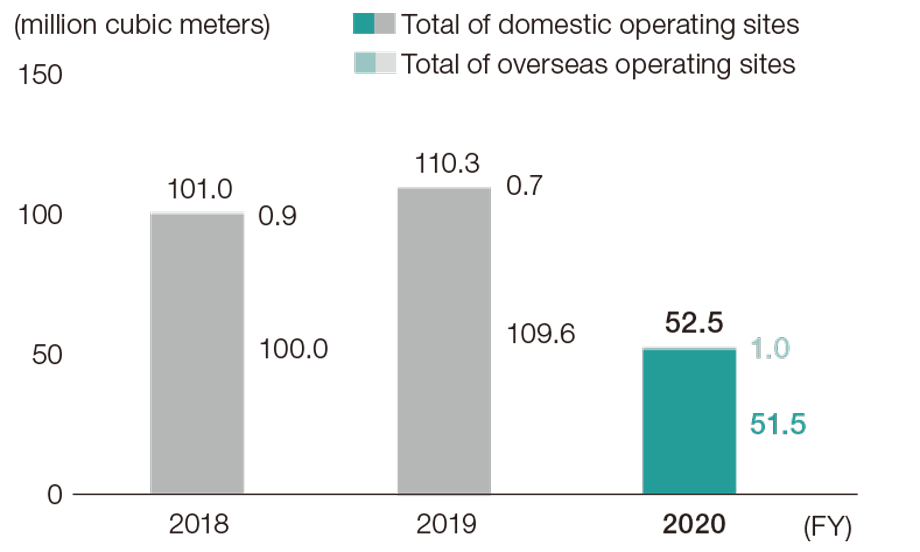
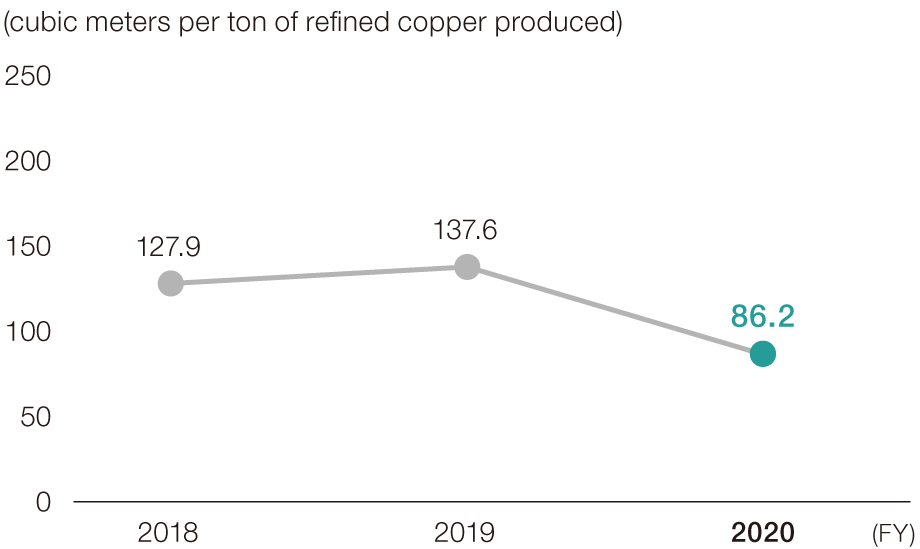
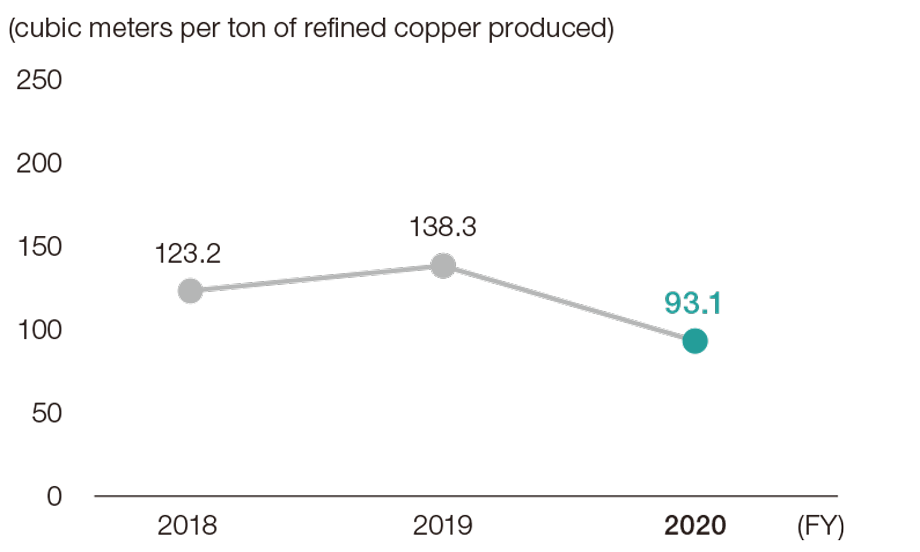
* Figures have been retroactively revised back to fiscal 2018 due to changes in aggregation scope to cover the entire JX Nippon Mining & Metals Group, in principle.
| Domestic operating sites | Overseas operating sites | |
|---|---|---|
| Kerosene (kL) | 272 | ― |
| Light oil (kL) | 2,970 | 51,476 |
| Class A heavy oil (kL) | 10,827 | 1,282 |
| Class B and C heavy oil (kL) | 22,267 | 5,425 |
| Reclaimed oil (kL) | 1,017 | ― |
| LPG/Butane (t) | 5,292 | 8 |
| LNG (t) | 4,770 | 760 |
| Coke (t) | 2,146 | ― |
| Petroleum coke (t) | 6,017 | ― |
| City gas (thousand cubic meters) | 16,964 | 2,446 |
* Applicable to specified consigners as defined in the Act on the Rational Use of Energy. Four Group companies fall under this definition: JX Nippon Mining & Metals Corporation, JX Metals Smelting Co., Ltd., Kasuga Mines Co., Ltd., and Pan Pacific Copper Co., Ltd.
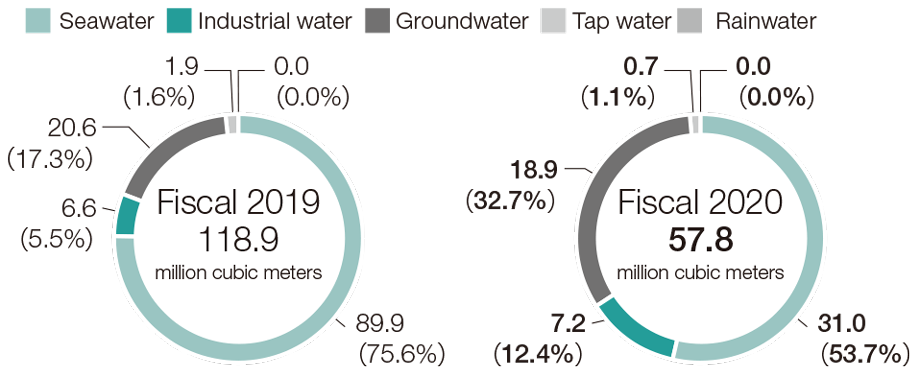
*1 Seawater usage at the Saganoseki Smelter & Refinery of JX Metals Smelting Co., Ltd. is calculated based on pumping capacity. Freshwater usage at the Saganoseki Smelter & Refinery of JX Metals Smelting Co., Ltd. and water usage at other operating sites are based on flowmeter readings or on invoices from the site’s respective water utility.
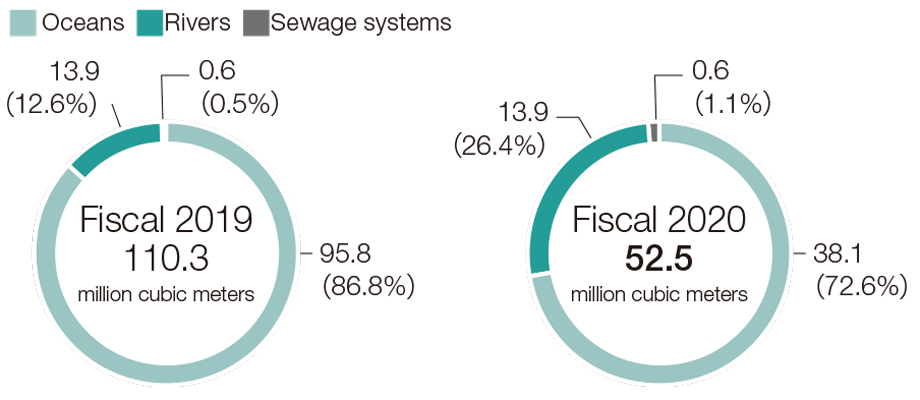
*2 The volume of water discharged into public waters (oceans and rivers) at each operating site represents the following: an amount calculated based on drainage weirs (Hitachi Works, Isohara Works, JX Nippon Tomakomai Chemical Co., Ltd., and JX Nippon Mikkaichi Recycle Co., Ltd.); an amount obtained by multiplying groundwater usage by a fixed rate (Kurami Works, Toho Titanium Co., Ltd.’s Headquarters & Chigasaki Plant); an amount from invoices (Toho Titanium Co., Ltd.’s Yahata Plant and Kurobe Plant); or an amount based on flowmeter readings (other operating sites). The volume of water discharged into the sewage system at each operating site represents the following: an amount calculated based on daily water discharge (TANIOBIS Co., Ltd.); or an amount based on flowmeter readings or on invoices from the site’s respective sewage utility for other operating sites. We have retroactively revised data for ocean discharge for the Saganoseki Smelter & Refinery as far back as fiscal 2018 due to changes made in the figure’s calculation method.
* We have retroactively revised figures for discharge for Saganoseki Smelter & Refinery as far back as fiscal 2018 due to changes made in the figure’s calculation method.
* Totals are for operating sites subject to legal requirements (sites that discharge water into oceans).
* We have retroactively revised data as far back as fiscal 2018 due to revised discharge data in the Water Resources section.
* Totals are for operating sites subject to legal requirements (sites that discharge water into rivers or streams).
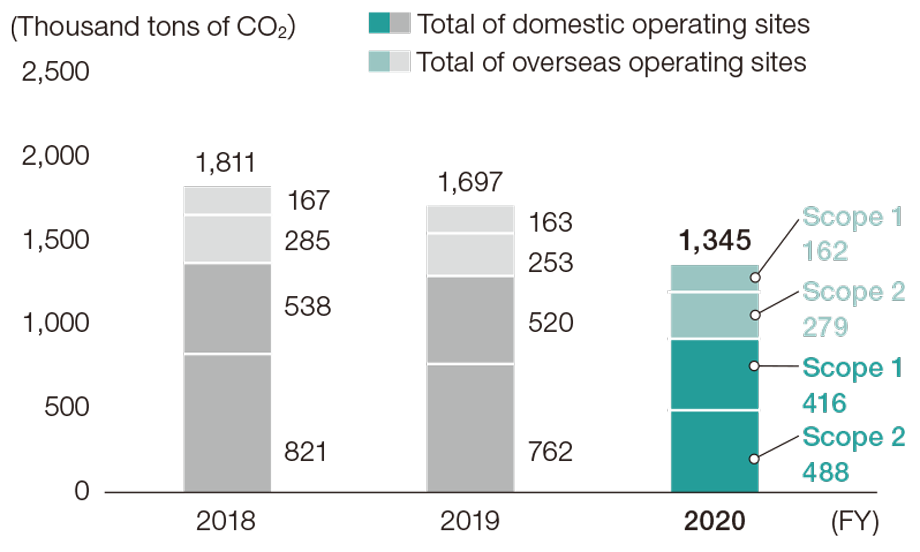
* We have made retroactive revisions as far back as fiscal 2018 due to the following factors.
• Expansion of aggregation scope to cover the entire JX Nippon Mining & Metals Group, in principle
• Review of emission factors applied to electricity consumption
• Expansion of the scope of activities subject to calculation of non-energy-derived CO₂ emissions
* Scope 1 emissions are those from energy consumption (fuel), emissions from incineration of waste materials (waste oil, waste plastic, sludge, waste wood), and emissions from reducing agents, neutralizing agents, graphite electrodes, and recycled materials, converted to equivalent CO₂.。
* Scope 2 emissions are those from electricity consumption converted to equivalent CO₂. Emissions from electricity consumption include those from thermal energy (consuming steam, hot water, cold water) supplied by third parties. The emission factors applied for Scope 2 calculation are as follows for domestic and overseas Group operating sites, respectively.
Domestic: Adjusted emission factors are applied
Overseas: Emission factors published by local power companies or country-specific emission factors published by the IEA are applied
* Applicable to specified consigners as defined in the Act on the Rational Use of Energy. Four Group companies fall under this definition: JX Nippon Mining & Metals Corporation, JX Metals Smelting Co., Ltd., Kasuga Mines Co., Ltd., and Pan Pacific Copper Co., Ltd.
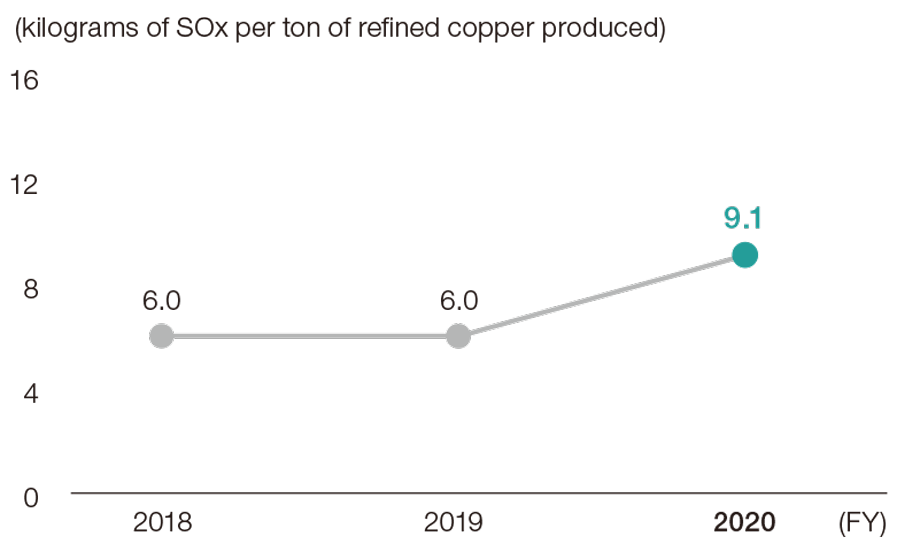
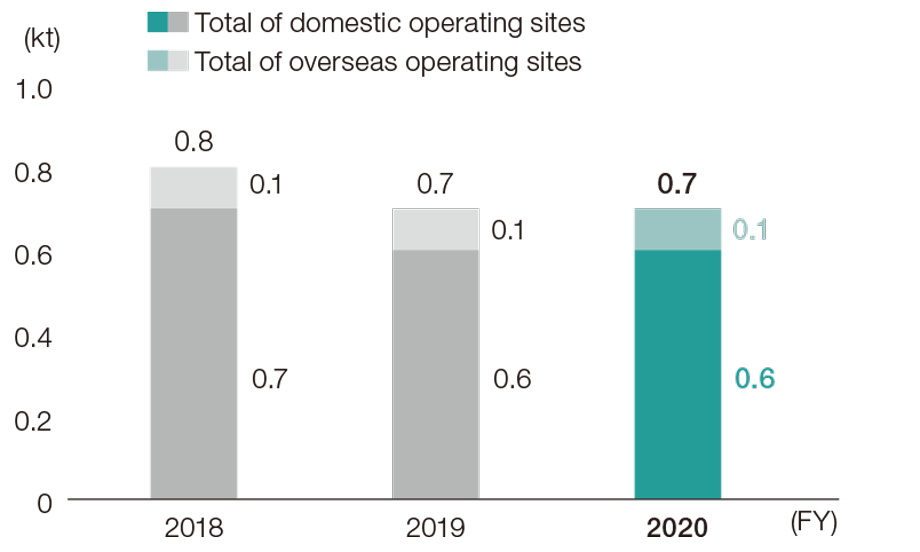
* Totals are for operating sites subject to emissions regulations.
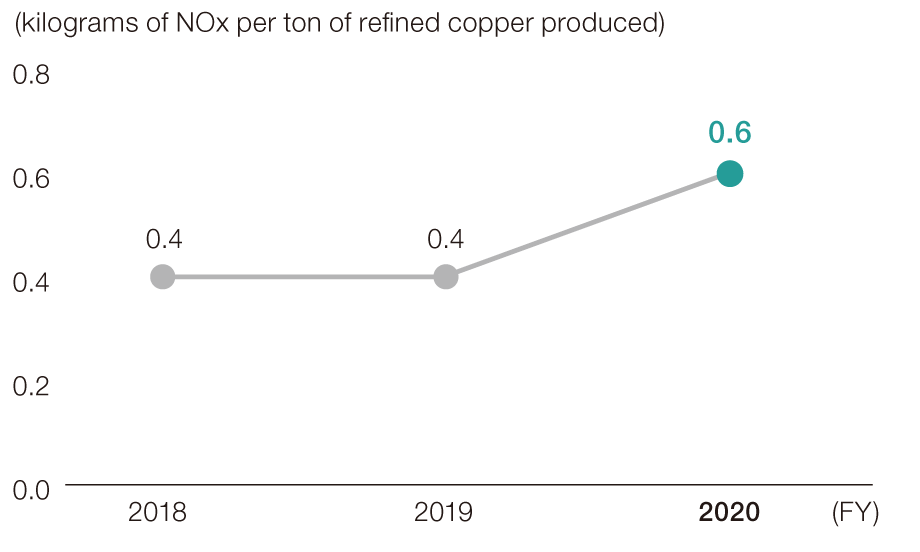
* Totals are for operating sites subject to emissions regulations.
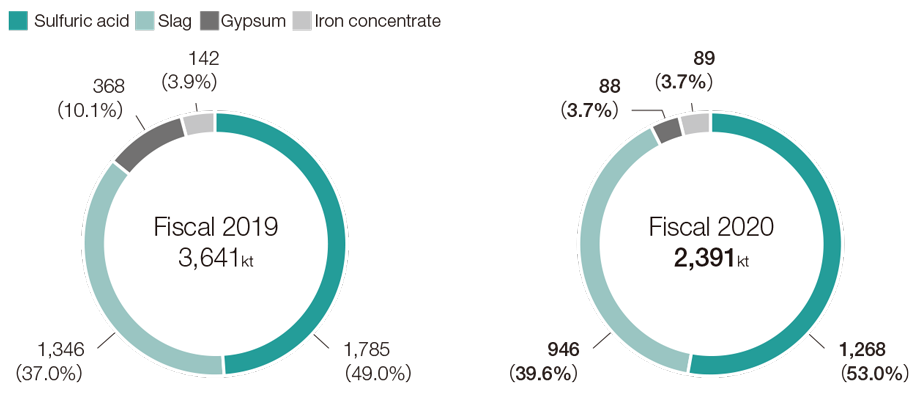
* These do not include the approximately 28.5 million tons of slag from the Caserones Copper Mine.
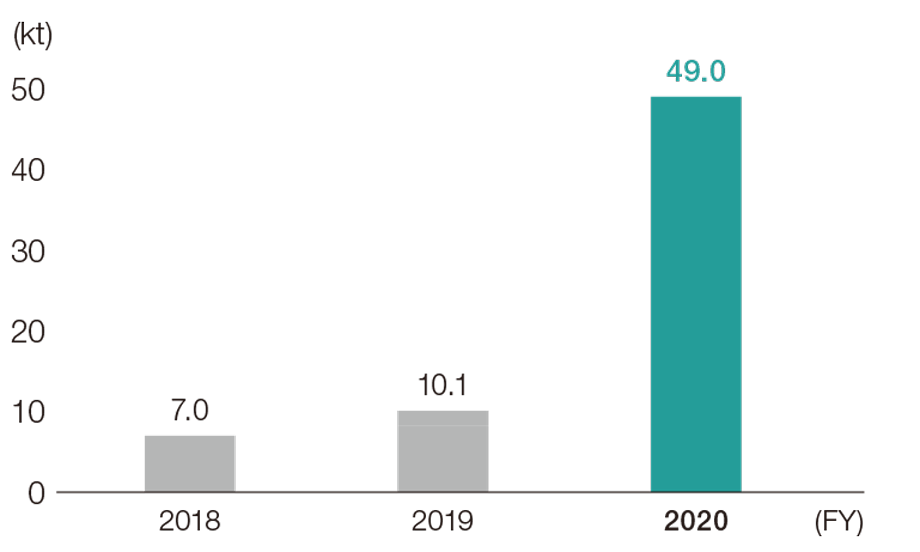
* The volume of final disposal of waste has increased rapidly due to the inclusion of Toho Titanium’s offshore landfill volume and final disposal volume of the TANIOBIS Group in calculations, as of fiscal 2020.
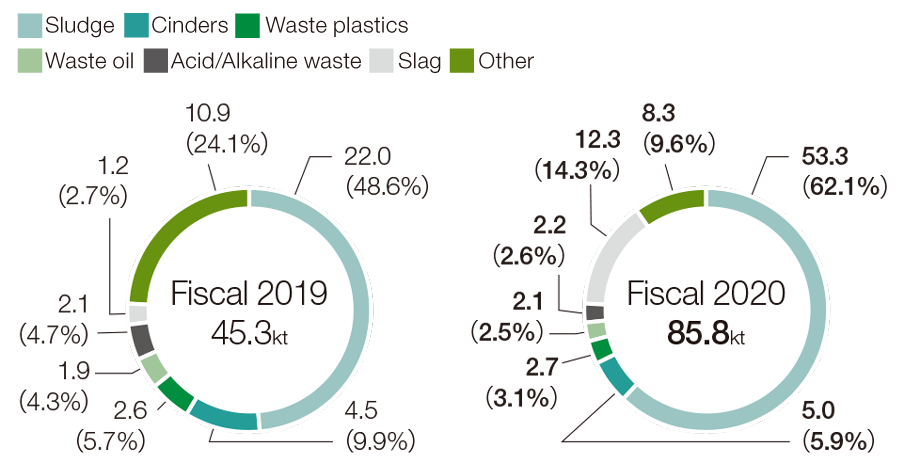
* The volume of total emissions has increased rapidly due to the inclusion of Toho Titanium’s offshore landfill volume and the TANIOBIS Group’s emissions volume in calculations, as of fiscal 2020.
| No. | Cabinet order no. | Chemical substance | Release volume | Transfer volume | |||
|---|---|---|---|---|---|---|---|
| Air | Water | On-site landfill disposal | Sewage systems | Waste materials | |||
| 1 | 75 | Cadmium and its compounds | 0.1 | 0.1 | 0.0 | 0.0 | 20.0 |
| 2 | 132 | Cobalt and its compounds | 0.0 | 0.3 | 0.0 | 0.0 | 26.0 |
| 3 | 300 | Toluene | 33.7 | 0.0 | 0.0 | 1.3 | 352.7 |
| 4 | 305 | Lead compounds | 0.8 | 0.1 | 0.0 | 0.0 | 10.2 |
| 5 | 309 | Nickel compounds | 0.1 | 0.5 | 0.0 | 0.0 | 20.0 |
| 6 | 354 | Dibutyl phthalate | 0.0 | 0.0 | 0.0 | 0.0 | 6.5 |
| 7 | 405 | Boron compounds | 0.0 | 9.3 | 0.0 | 0.0 | 1.7 |
| 8 | 243 | Dioxins | 0.1 | 0.0 | 0.0 | 0.0 | 6.0 |
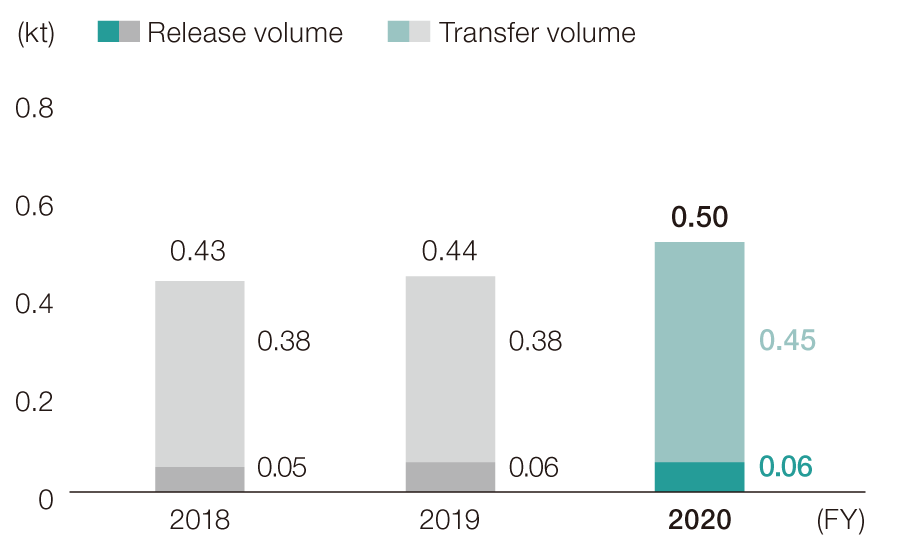
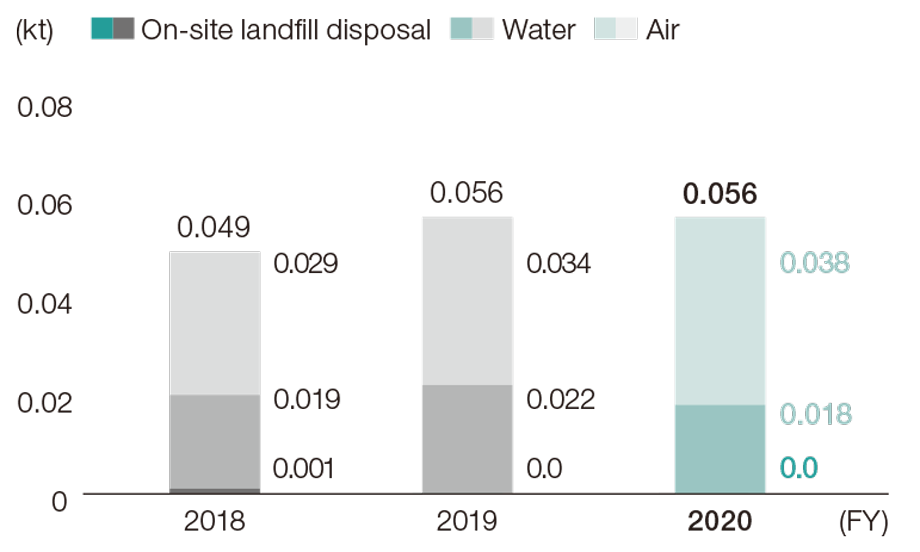
* The values given are totals for companies with operating sites subject to reporting requirements under the PRTR Act (JX Metals Trading Co., Ltd., Kasuga Mines Co., Ltd., TANIOBIS Japan Co., Ltd., and the domestic companies defined in boundary of the Report on page 4 as subject to「 Environment section reporting」).
Of the 50 chemical substances subject to reporting, those totaling at least 5.0 tons in any category, and dioxins, are listed here. There were no cases of chemical substances released into the soil.
| Category | 2018 | 2019 | 2020 | |||
|---|---|---|---|---|---|---|
| Safety performance at domestic operating sites*3 |
Employees (including Group companies) |
Casualties of occupational accidents | Fatalities (persons) *4 | 0 | 0 | 0 |
| Occupational accidents with severe consequences (persons) *4 |
0 | 0 | 0 | |||
| Accidents with lost work days (persons) *4 | 13 | 3 | 7 | |||
| Accidents without lost work days (persons) *4 | 9 | 10 | 13 | |||
| Total (persons) | 22 | 13 | 20 | |||
| Major types of occupational accidents *5 | Strain or overexertion | 4 | 1 | 5 | ||
| Fall on same level | 7 | 1 | 1 | |||
| Caught in, on or between | 4 | 1 | 3 | |||
| Frequency rate of industrial accidents *6 | Fatalities *4 | - | - | 0.00 | ||
| Occupational accidents with severe consequences *4 |
- | - | 0.00 | |||
| Accidents with lost work days *4 | - | - | 0.53 | |||
| Severity rate of industrial accidents *6 | - | - | 0.03 | |||
| Cumulative work hours *6 | - | - | 13,290,060 | |||
| Employees of subcontractors *7 | Casualties of occupational accidents *5 | Fatalities (persons) | 0 | 0 | 2 | |
| Occupational accidents with severe consequences (persons) |
0 | 2 | 0 | |||
| Accidents with lost work days (persons) | 6 | 2 | 2 | |||
| Accidents without lost work days (persons) | 3 | 5 | 6 | |||
| Total (persons) | 9 | 9 | 10 | |||
| Major types of occupational accidents *5 | Cut or rubbed | 2 | 1 | 4 | ||
| Crashes or falls to lower level | 0 | 0 | 2 | |||
| Struck by object | 0 | 2 | 0 | |||
| Frequency rate of industrial accidents *6.7 | Fatalities *4 | - | - | 0.64 | ||
| Occupational accidents with severe consequences *4 |
- | - | 0.00 | |||
| Accidents with lost work days *4 | - | - | 0.64 | |||
| Severity rate of industrial accidents *6.7 | - | - | 4.82 | |||
| Cumulative work hours *7 | - | - | 3,117,548 | |||
| Total casualties (persons) | 31 | 22 | 30 | |||
| Occupational injury rate per 1,000 employees (four or more lost workdays)*8 | 1.6 | 0.7 | 1.1 | |||
| Explosions and fires (incidences)*9 | 3 | 3 | 1 | |||
| (Reference) Safety performance at overseas operating sites *10 |
Fatalities (persons) | 0 | 1 | 0 | ||
| Accidents with lost work days (persons) | 16 | 18 | 13 | |||
| Accidents without lost work days (persons) | 2 | 3 | 5 | |||
| Total (persons) | 18 | 22 | 18 | |||
| Major types of occupational accidents | Caught in, on or between | 4 | 8 | 3 | ||
| Fall on same level | 1 | 1 | 5 | |||
| Strain or overexertion | 4 | 0 | 3 | |||
*1 Safety performance data is compiled on a calendar year basis (January to December).
*2 The number of casualties presented in this table includes work-related illnesses such as back pain and heat stroke.
*3 Until 2020, data included the Company and other Group companies (excluding Toho Titanium); however, from 2020, Toho Titanium and subcontractors have also been included in the scope of aggregation, and data has been retroactively revised as far back as 2018. Note that frequency and severity rates are excluded.
*4 Each accident category is defined as follows.
• Fatalities: Worker deaths resulting from work-related causes.
• Occupational accidents with severe consequences: Accidents resulting in more than six months of lost work days or a disability grade.
• Accidents with lost work days: Accidents requiring one or more days of absence from work for the purpose of examination, treatment or recuperation. These shall in principle be at a physician’s discretion. Note that this excludes “Occupational accidents with severe consequences.”
• Accidents without lost work days: An accident that does not require one full day or more of absence from work as diagnosed by a physician, and in which the affected worker is able to go to work after the accident.
*5 Incidences related to the cause of the injury or illness, based on “Types of Accidents,” published by the Ministry of Health, Labour and Welfare.
*6 Both the frequency rate (the number of persons harmed or killed due to occupational accidents per million cumulative actual work hours) and the severity rate (number of work days lost per thousand cumulative actual work hours) had only covered Company employees until 2020; however, as of 2020, these figures cover Company employees and employees at other Group companies (including Toho Titanium). Note that cumulative working hours include some estimated figures.
*7 Safety statistics for subcontractor employees include not only those stationed permanently but also spot vendors. Note that these are subject to statistics for frequency rate and severity rate as of 2020. Here, cumulative work hours are calculated as follows: Number of permanently stationed subcontractor employees at the end of each month x number of operating days x 8 hours/day. (Reference) In 2020, the frequency and severity rate of occupational accidents for all businesses in Japan were 1.95 and 0.09, respectively. (Source: Ministry of Health, Labour and Welfare, “Survey on Industrial Accidents”)
*8 The Group defines a serious accident as one that results in four or more days of lost work, and considers the occupational injury rate per 1,000 employees to be one of its key indicators. (Occupational injury rate per 1,000 employees (four or more lost workdays) = number of casualties with four or more days of lost work ÷ total number of employees (including employees of regular partner companies) x 1,000)
*9 No physical injuries were caused as a result of explosions/fires.
*10 While this includes Group companies and subcontractors, this data should be used only for reference as it is difficult to conduct follow-up surveys and aggregate working hours for subcontractors at overseas operating sites, and detailed data such as frequency rates are not disclosed.
(hours)
| Managerial staff | Non-management employees | Total | |||||||
|---|---|---|---|---|---|---|---|---|---|
| Men | Women | Overall | Men | Women | Overall | Men | Women | Overall | |
| Total program hours (annual) | 8,497 | 334 | 8,831 | 58,364 | 8,562 | 66,926 | 66,861 | 8,896 | 75,757 |
| Per employee | 14 | 22 | 14 | 26 | 27 | 26 | 23 | 27 | 24 |
* Survey scope: Employees of JX Nippon Mining & Metals plus those seconded by the Company to JX Nippon Environmental Services Co., Ltd. and JX Metals Smelting Co., Ltd. (Saganoseki Smelter & Refinery, Hitachi Refinery)
Survey scope: Companies in which JX Nippon Mining & Metals has 50% or more of their voting rights, directly or indirectly
Counting of seconded employees: Includes all employees being seconded to or from the companies subject to this survey
(persons)
| Employment status | Contract type | Male | Female | Total |
|---|---|---|---|---|
| Full-time | Contracts without fixed terms | 7,955 | 1,217 | 9,172 |
| Contracts with fixed terms | 469 | 100 | 569 | |
| Full-time subtotal | 8,424 | 1,317 | 9,741 | |
| Part-time | Contracts without fixed terms | 21 | 36 | 57 |
| Contracts with fixed terms | 57 | 32 | 89 | |
| Part-time subtotal | 78 | 68 | 146 | |
| Total | 8,502 | 1,385 | 9,887 | |
(persons)
| Employment status | Contract type | Japan | North America | South America | Asia | Europe | Middle East | Total |
|---|---|---|---|---|---|---|---|---|
| Full-time | Contracts without fixed terms | 6,313 | 125 | 955 | 1,396 | 368 | 15 | 9,172 |
| Contracts with fixed terms | 472 | 2 | 12 | 65 | 18 | 0 | 569 | |
| Full-time subtotal | 6,785 | 127 | 967 | 1,461 | 386 | 15 | 9,741 | |
| Part-time | Contracts without fixed terms | 39 | 0 | 0 | 1 | 17 | 0 | 57 |
| Contracts with fixed terms | 86 | 0 | 2 | 0 | 1 | 0 | 89 | |
| Part-time subtotal | 125 | 0 | 2 | 1 | 18 | 0 | 146 | |
| Total | 6,910 | 127 | 969 | 1,462 | 404 | 15 | 9,887 | |
(persons)
| Japan | North America | South America | Asia | Europe | Middle East | Total | |
|---|---|---|---|---|---|---|---|
| Male | 6,136 | 100 | 887 | 1,025 | 339 | 15 | 8,502 |
| Female | 774 | 27 | 82 | 437 | 65 | 0 | 1,385 |
| Total | 6,910 | 127 | 969 | 1,462 | 404 | 15 | 9,887 |
| Male | Female | Total | |
|---|---|---|---|
| New hires | 509 | 115 | 624 |
| Percent of total employee count as of March 31, 2021 | 6% | 8% | 6% |
| Age 29 or younger | Age 30 to 49 | Age 50 or older | Total |
|---|---|---|---|
| 290 | 235 | 99 | 624 |
| 20% | 4% | 4% | 6% |
| Japan | North America | South America | Asia | Europe | Middle East | Total | |
|---|---|---|---|---|---|---|---|
| New hires | 422 | 18 | 71 | 105 | 8 | 0 | 624 |
| Percent of total employee count as of March 31, 2021 |
6% | 14% | 7% | 7% | 2% | 0% | 6% |
| Male | Female | Total | |
|---|---|---|---|
| Retiring employees | 465 | 64 | 529 |
| Percent of total employee count as of March 31, 2021 | 5% | 5% | 5% |
| Age 29 or younger | Age 30 to 49 | Age 50 or older | Total |
|---|---|---|---|
| 109 | 248 | 172 | 529 |
| 7% | 4% | 7% | 5% |
| Japan | North America | South America | Asia | Europe | Middle East | Total | |
|---|---|---|---|---|---|---|---|
| Retiring employees | 286 | 8 | 105 | 109 | 21 | 0 | 529 |
| Percent of total employee count as of March 31, 2021 |
4% | 6% | 11% | 7% | 5% | 0% | 5% |
* Figures include employees transferred to companies outside of survey scope and those returning due to termination of secondment.
* Figures do not include employees who were transferred within a company inside the survey scope, or those returning due to termination of secondment.
* Employees retiring at the mandatory retirement age are not in scope.
| Male | Female | Total | |
|---|---|---|---|
| No. of union members | 5,373 | 758 | 6,131 |
| Percent of total employee count as of March 31, 2021 |
63% | 55% | 62% |
| Age 29 or younger | Age 30 to 49 | Age 50 or older | Total |
|---|---|---|---|
| 1,095 | 3,901 | 1,135 | 6,131 |
| 75% | 66% | 45% | 62% |
Strikes or lockouts lasting more than one week: None
| Male | Female | Total | |
|---|---|---|---|
| No. of employees using leave | 19 | 12 | 31 |
| No. of employees eligible to use leave* | 117 | 12 | 129 |
| Usage rate (rounded to nearest percent) | 16% | 100% | 24% |
* Male: Employees with a child born within the fiscal year
Female: Employees whose post-childbirth leave ended during the fiscal year and who can take childcare leave
| Male | Female | Total | |
|---|---|---|---|
| No. of employees who returned to work from childcare leave during fiscal 2019 |
8 | 10 | 18 |
| No. of employees still employed 12 months after returning to work |
8 | 10 | 18 |
| Percentage | 100% | 100% | 100% |
| Male | Female | Total | |
|---|---|---|---|
| No. of employees who returned to work from childcare leave during fiscal 2020 |
19 | 3 | 22 |
| No. of employees scheduled to return to work | 19 | 4 | 23 |
| Percentage | 100% | 75% | 96% |
| No. of age-limited retirees | 47 |
| No. of these rehired | 44 |
| Rehiring rate (%) | 94% |
| Percentage of employees with disabilities (statutory minimum: 2.3%) | 2.19% |
| Number of senior managers |
Senior managers as a share of locally hired employees *1 |
Number of locally hired employees *2 |
||
|---|---|---|---|---|
| North America | Male | 14 | 16% | 87 |
| Female | 4 | 15% | 27 | |
| North America subtotal | 18 | 16% | 114 | |
| South America | Male | 38 | 4% | 847 |
| Female | 5 | 6% | 82 | |
| South America subtotal | 43 | 5% | 929 | |
| Europe | Male | 36 | 11% | 321 |
| Female | 7 | 11% | 63 | |
| Europe subtotal | 43 | 11% | 384 | |
| Asia | Male | 93 | 10% | 960 |
| Female | 54 | 12% | 433 | |
| Asia subtotal | 147 | 11% | 1,393 | |
| Male | 181 | 8% | 2,215 | |
| Female | 70 | 12% | 605 | |
| Total | 251 | 9% | 2,820 | |
Scope of aggregation: Overseas Group companies in which JX Nippon Mining & Metals has 50% or more of their voting rights, directly or indirectly Treatment of seconded employees: Employees seconded from companies outside of survey scope to companies inside of survey scope are counted. Employees seconded from companies inside of survey scope to companies outside of survey scope are also counted.
*1 Percentage calculated as (Number of senior managers ÷ Number of locally hired employees) x 100
*2 The number of employees directly employed by overseas subsidiaries, excluding employees on secondment and employees transferred to overseas subsidiaries