
ICMM, of which JX Nippon Mining & Metals is a member, requires its member companies to conduct PEs*, a program to verify each company’s progress in achieving the roles and results expected of the mining and metals industry. In response, the Group conducted a self-assessment of its corporate office and seven sites. The following is a summary of the assessment results.
Of the sites for which self-assessment was conducted, we plan to undergo third-party validation at the Saganoseki Smelter & Refinery and Hitachi Works, both of JX Metals Smelting Co., Ltd., as well as the Caserones Copper Mine. This is due to their high quantitative importance in terms of elements such a business scale and production volume.
| Site | Results | Total | |||
|---|---|---|---|---|---|
| Meets*1 | Partially Meets*1 | Does not meet*1 | Not applicable*1 | ||
| Corporate | 13 | 15 | 1*2 | 0 | 29 |
| JX Metals Smelting Co., Ltd. (Saganoseki Smelter & Refinery) | 21 | 3 | 0 | 7 | 31 |
| JX Metals Smelting Co., Ltd. (Hitachi Works) | 21 | 3 | 0 | 7 | 31 |
| TANIOBIS (Goslar) | 21 | 3 | 0 | 7 | 31 |
| TANIOBIS (Laufenburg) | 21 | 3 | 0 | 7 | 31 |
| TANIOBIS (Thailand) | 21 | 3 | 0 | 7 | 31 |
| Caserones Copper Mine | 27 | 3 | 0 | 1 | 31 |
| Kasuga Mine | 22 | 3 | 0 | 6 | 31 |
Click to enlarge
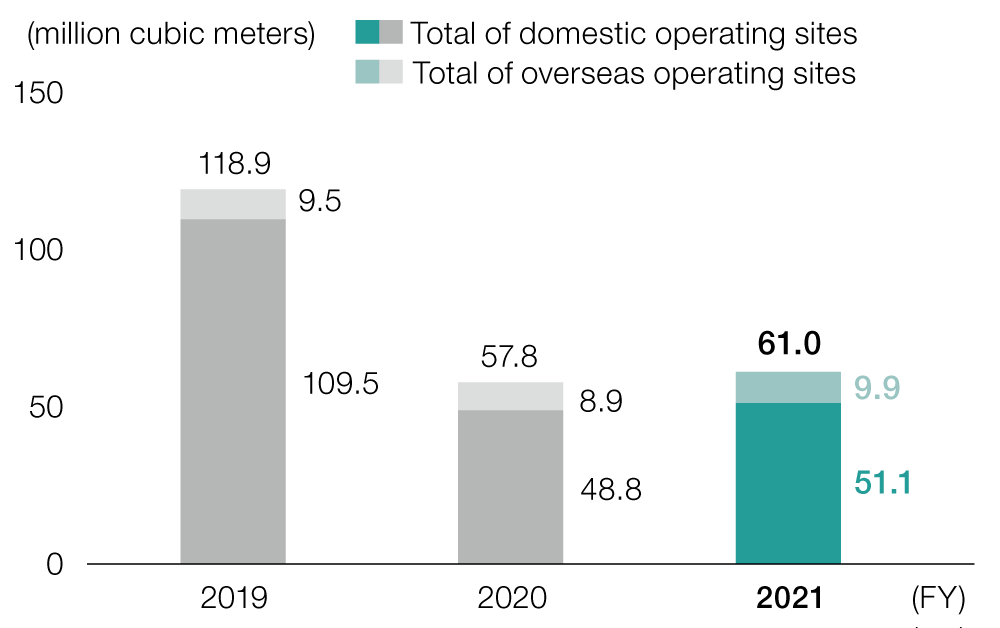
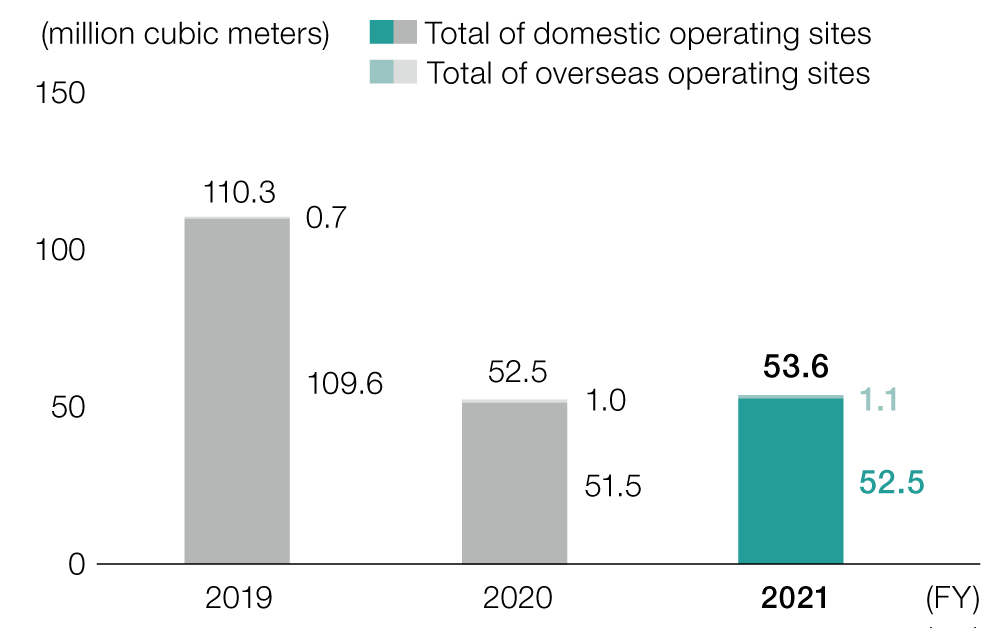
| Domestic Operating Sites: 29 | Overseas Operating Sites: 12 |
|---|---|
|
Hitachi Works of JX Nippon Mining & Metals Corporation (including HMC Manufacturing |
JX Nippon Mining & Metals Philippines, Inc. |
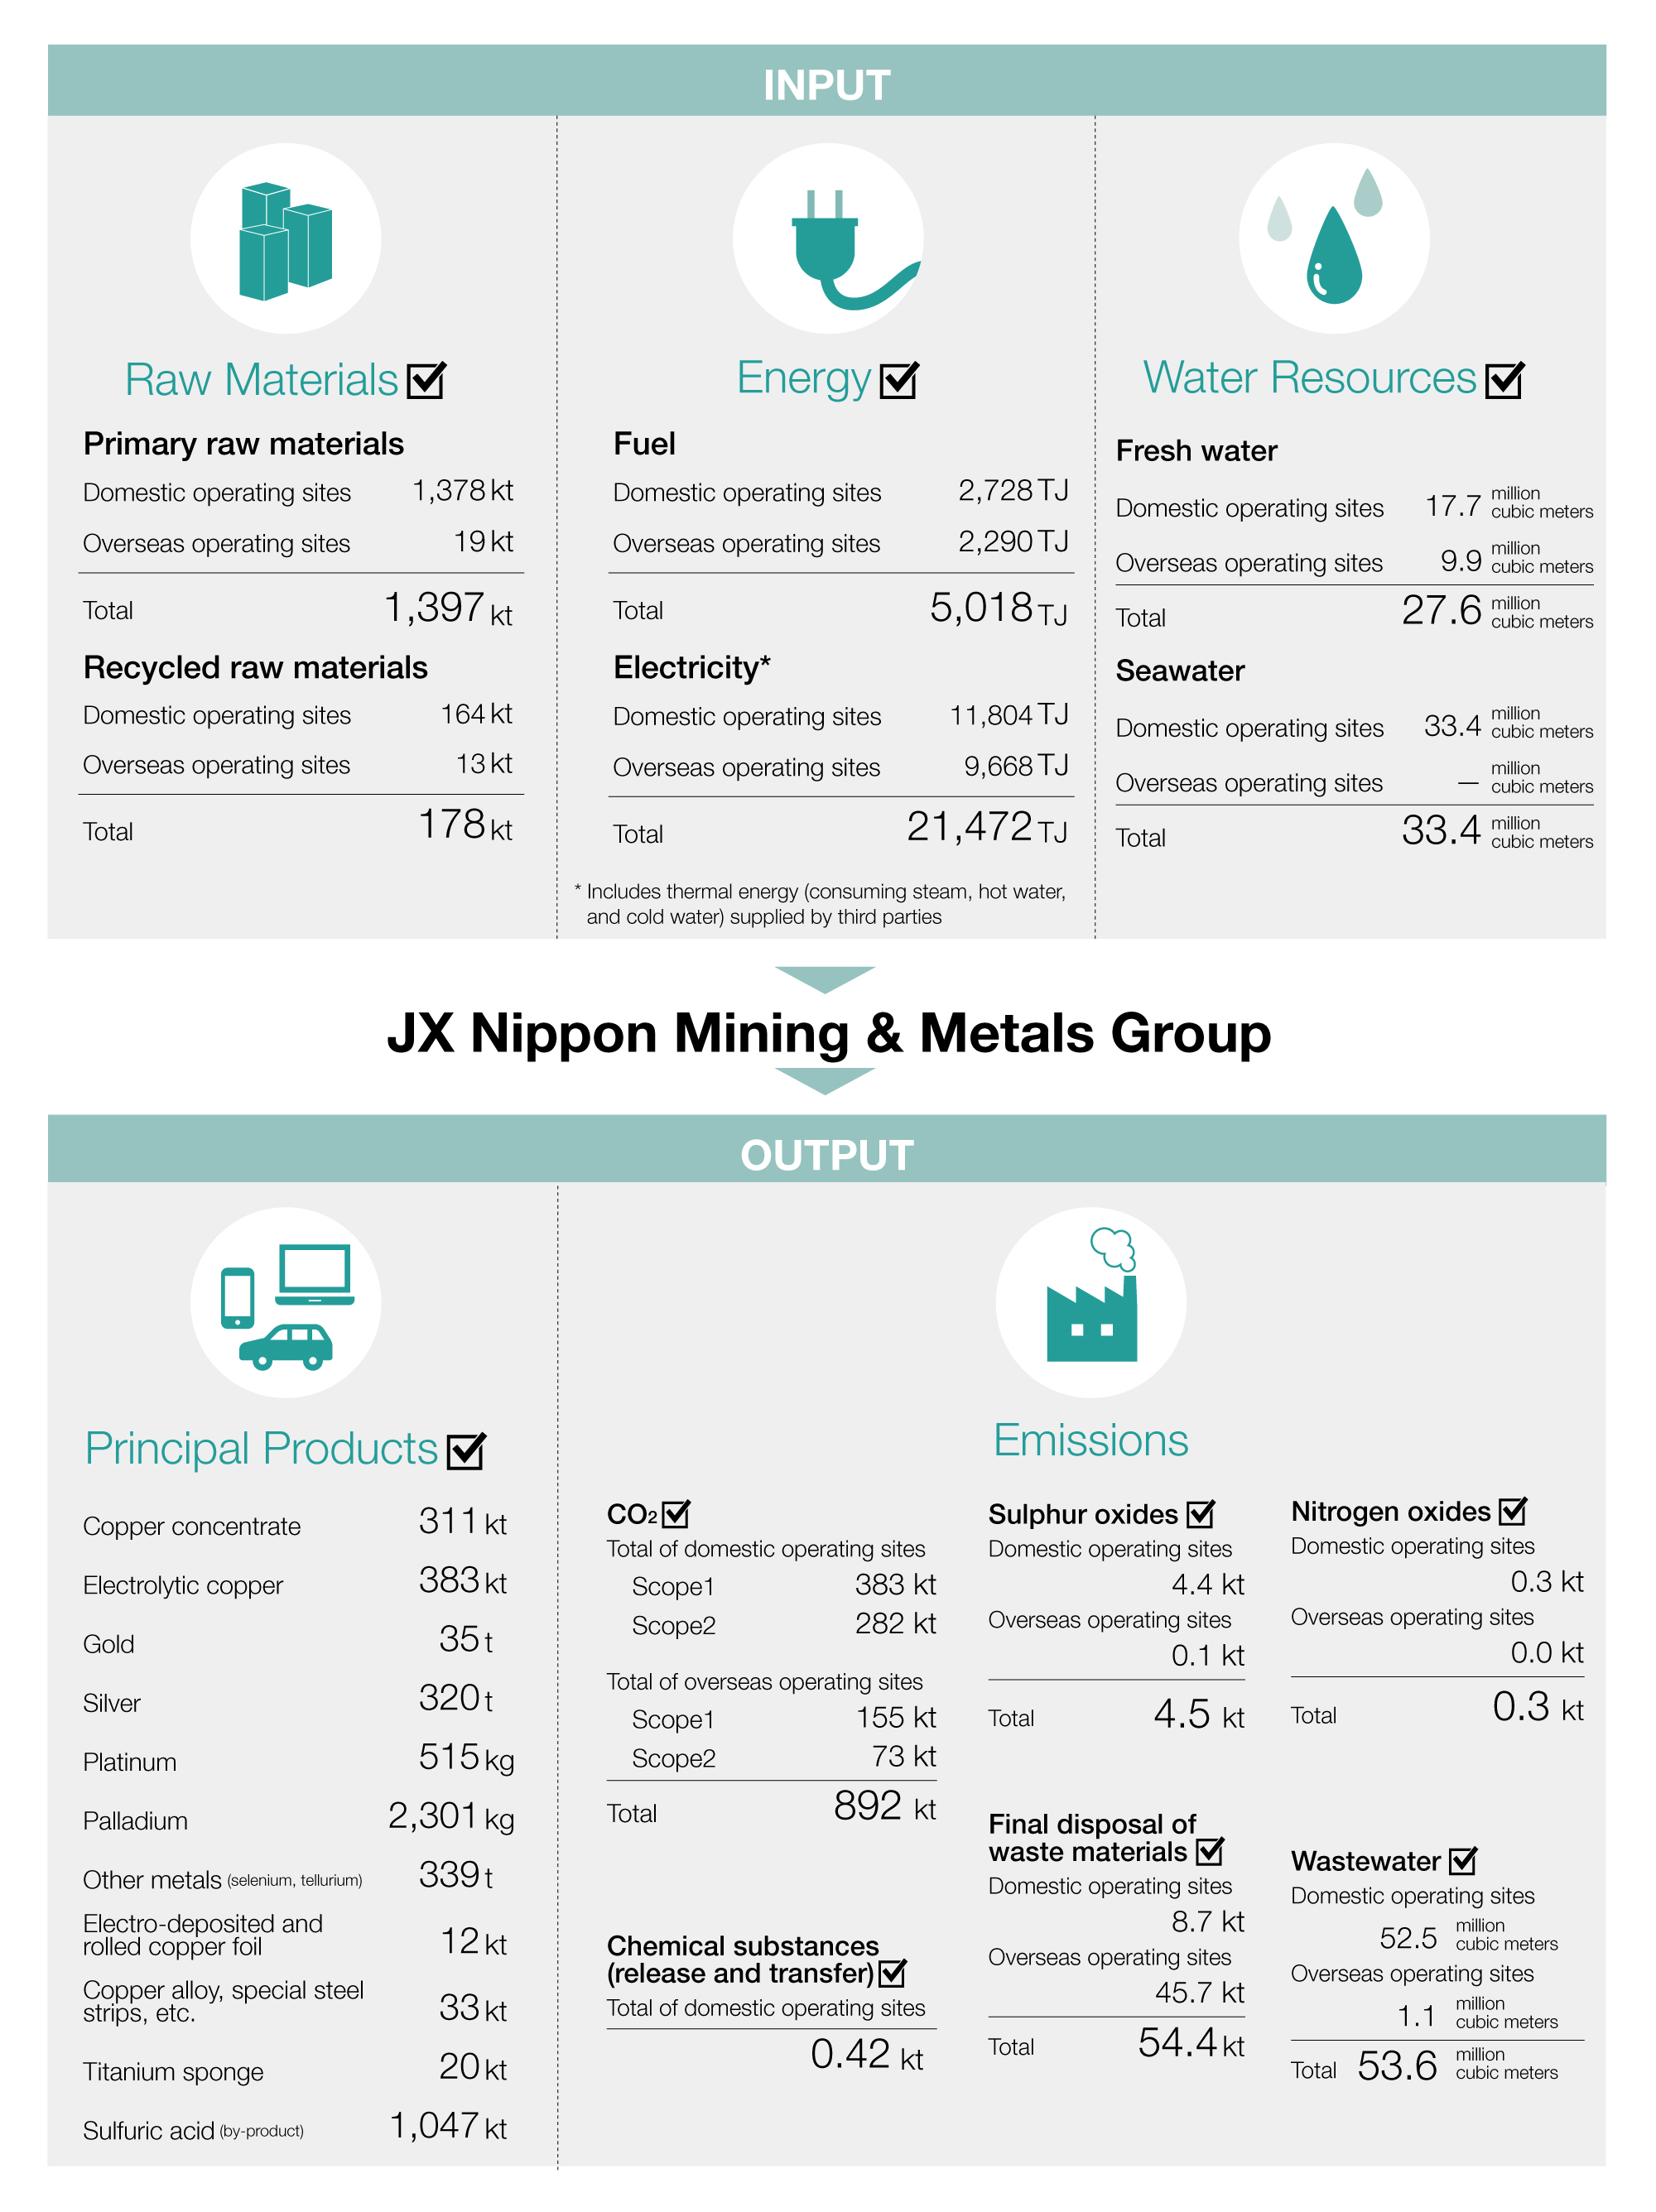
| Domestic operating sites | Overseas operating sites | |
|---|---|---|
| Kerosene (kL) | 143 | ― |
| Light oil (kL) | 2,725 | 52,663 |
| Class A heavy oil (kL) | 9,755 | 1,003 |
| Class B and C heavy oil (kL) | 14,492 | 1,972 |
| Reclaimed oil (kL) | 2,558 | ― |
| LPG/Butane (t) | 5,399 | 7 |
| LNG (t) | 4,664 | 843 |
| Coke (t) | 3,146 | ― |
| Petroleum coke (t) | 2,558 | ― |
| City gas (thousand cubic meters) | 18,343 | 2,980 |


| No. | Cabinet order no. | Chemical substance | Release volume | Transfer volume | |||
|---|---|---|---|---|---|---|---|
| Air | Water | On-site landfill disposal | Sewage systems | Waste materials | |||
| 1 | 31 | Antimony and its compounds | 0.1 | 0.5 | 0.0 | 0.0 | 7.9 |
| 2 | 75 | Cadmium and its compounds | 0.1 | 0.1 | 0.0 | 0.0 | 20.8 |
| 3 | 132 | Cobalt and its compounds | 0.0 | 0.1 | 0.0 | 0.0 | 19.5 |
| 4 | 300 | Toluene | 32.0 | 0.0 | 0.0 | 1.6 | 281.0 |
| 5 | 305 | Lead compounds | 0.7 | 0.1 | 0.0 | 0.0 | 14.6 |
| 6 | 309 | Nickel compounds | 0.1 | 0.4 | 0.0 | 0.0 | 9.3 |
| 7 | 354 | Dibutyl phthalate | 0.0 | 0.0 | 0.0 | 0.3 | 5.8 |
| 8 | 405 | Boron compounds | 0.0 | 9.3 | 0.0 | 0.0 | 3.5 |
| 9 | 243 | Dioxins | 0.1 | 0.0 | 0.0 | 0.0 | 7.0 |
| Category | 2019 | 2020 | 2021 | |||
|---|---|---|---|---|---|---|
| Safety performance at domestic operating sites*3 | Employees (including Group companies) | Casualties of occupational accidents | Fatalities (persons)*4 | 0 | 0 | 0 |
| Occupational accidents with severe consequences (persons)*4 | 0 | 0 | 0 | |||
| Accidents with lost work days (persons)*4 | 3 | 7 | 10 | |||
| Accidents without lost work days (persons)*4 | 10 | 13 | 24 | |||
| Total (persons) | 13 | 20 | 34 | |||
| Major types of occupational accidents*5 | Strain or overexertion | 1 | 5 | 6 | ||
| Fall on same level | 1 | 1 | 3 | |||
| Caught in, on or between | 1 | 3 | 1 | |||
| Frequency rate of industrial accidents*6 | Fatalities*4 | - | 0.00 | 0.00 | ||
| Occupational accidents with severe consequences*4 | - | 0.00 | 0.00 | |||
| Accidents with lost work days*4 | - | 0.53 | 0.74 | |||
| Severity rate of industrial accidents*6 | - | 0.03 | 0.03 | |||
| Cumulative work hours*6 | - | 13,290,060 | 13,442,362 | |||
| Employees of subcontractors*7 | Casualties of occupational accidents*5 | Fatalities (persons) | 0 | 2 | 0 | |
| Occupational accidents with severe consequences (persons) | 2 | 0 | 0 | |||
| Accidents with lost work days (persons) | 2 | 2 | 6 | |||
| Accidents without lost work days (persons) | 5 | 6 | 13 | |||
| Total (persons) | 9 | 10 | 19 | |||
| Major types of occupational accidents*5 | Cut or rubbed | 1 | 4 | 4 | ||
| Crashes or falls to lower level | 0 | 2 | 2 | |||
| Struck by object | 2 | 0 | 0 | |||
| Frequency rate of industrial accidents *6,7 | Fatalities*4 | - | 0.64 | 0.00 | ||
| Occupational accidents with severe consequences*4 | - | 0.00 | 0.00 | |||
| Accidents with lost work days*4 | - | 0.64 | 1.94 | |||
| Severity rate of industrial accidents *6,7 | - | 4.82 | 0.11 | |||
| Cumulative work hours *7 | - | 3,117,548 | 3,090,280 | |||
| Total casualties (persons) | 22 | 30 | 53 | |||
| Occupational injury rate per 1,000 employees (four or more lost workdays)*8 | 0.7 | 1.1 | 1.7 | |||
| Explosions and fires (incidences)*9 | 3 | 1 | 0 | |||
| (Reference) Safety performance at overseas operating sites*10 | Fatalities (persons) | 1 | 0 | 0 | ||
| Accidents with lost work days (persons) | 18 | 13 | 19 | |||
| Accidents without lost work days (persons) | 3 | 5 | 7 | |||
| Total (persons) | 22 | 18 | 26 | |||
| Major types of occupational accidents | Caught in, on or between | 8 | 3 | 8 | ||
| Fall on same level | 1 | 5 | 4 | |||
| Strain or overexertion | 0 | 3 | 3 | |||
(hours)
| Managerial staff | Non-management employees | Total | |||||||
|---|---|---|---|---|---|---|---|---|---|
| Male | Female | Total | Male | Female | Total | Male | Female | Total | |
| Total program hours (annual) | 13,049 | 505 | 13,554 | 54,244 | 7,646 | 61,890 | 67,293 | 8,151 | 75,444 |
| Per employee | 30 | 11 | 22 | 42 | 14 | 24 | 24 | 25 | 24 |
Survey scope: Companies in which JX Nippon Mining & Metals has 50% or more of their voting rights, directly or indirectly
Counting of seconded employees: Includes all employees being seconded to or from the companies subject to this survey
(persons)
| Employment status | Contract type | Male | Female | Total |
|---|---|---|---|---|
| Full-time | Contracts without fixed terms | 8,045 | 1,249 | 9,294 |
| Contracts with fixed terms | 524 | 120 | 644 | |
| Full-time subtotal | 8,569 | 1,369 | 9,938 | |
| Part-time | Contracts without fixed terms | 27 | 45 | 72 |
| Contracts with fixed terms | 67 | 36 | 103 | |
| Part-time subtotal | 94 | 81 | 175 | |
| Total | 8,663 | 1,450 | 10,113 | |
(persons)
| Employment status | Contract type | Japan | North America | South America | Asia | Europe | Middle East | Total |
|---|---|---|---|---|---|---|---|---|
| Full-time | Contracts without fixed terms | 6,456 | 123 | 916 | 1,423 | 364 | 12 | 9,294 |
| Contracts with fixed terms | 475 | 2 | 76 | 63 | 28 | 0 | 644 | |
| Full-time subtotal | 6,931 | 125 | 992 | 1,486 | 392 | 12 | 9,938 | |
| Full-time以外 | Contracts without fixed terms | 48 | 0 | 0 | 3 | 21 | 0 | 72 |
| Contracts with fixed terms | 102 | 0 | 0 | 0 | 1 | 0 | 103 | |
| Part-time subtotal | 150 | 0 | 0 | 3 | 22 | 0 | 175 | |
| Total | 7,081 | 125 | 992 | 1,489 | 414 | 12 | 10,113 | |
(persons)
| Japan | North America | South America | Asia | Europe | Middle East | Total | |
|---|---|---|---|---|---|---|---|
| Male | 6,266 | 96 | 904 | 1,043 | 342 | 12 | 8,663 |
| Female | 815 | 29 | 88 | 446 | 72 | 0 | 1,450 |
| Total | 7,081 | 125 | 992 | 1,489 | 414 | 12 | 10,113 |
| Male | Female | Total | |
|---|---|---|---|
| New hires | 718 | 151 | 869 |
| Percent of total employee count as of March 31, 2022 | 8% | 10% | 9% |
| Age 29 or younger | Age 30 to 49 | Age 50 or older | Total |
|---|---|---|---|
| 337 | 400 | 132 | 869 |
| 23% | 7% | 5% | 9% |
| Japan | North America | South America | Asia | Europe | Middle East | Total | |
|---|---|---|---|---|---|---|---|
| New hires | 581 | 28 | 140 | 108 | 12 | 0 | 869 |
| Percent of total employee count as of March 31, 2022 | 8% | 22% | 14% | 7% | 3% | 0% | 9% |
| Male | Female | Total | |
|---|---|---|---|
| Retiring employees | 550 | 95 | 645 |
| Percent of total employee count as of March 31, 2022 | 6% | 7% | 6% |
| Age 29 or younger | Age 30 to 49 | Age 50 or older | Total |
|---|---|---|---|
| 146 | 309 | 190 | 645 |
| 10% | 5% | 7% | 6% |
| Japan | North America | South America | Asia | Europe | Middle East | Total | |
|---|---|---|---|---|---|---|---|
| Retiring employees | 357 | 34 | 120 | 124 | 10 | 0 | 645 |
| Percent of total employee count as of March 31, 2022 | 5% | 27% | 12% | 8% | 2% | 0% | 6% |
| Male | Female | Total | |
|---|---|---|---|
| No. of union members | 5,426 | 799 | 6,225 |
| Unionization rate | 63% | 55% | 62% |
| Age 29 or younger | Age 30 to 49 | Age 50 or older | Total |
|---|---|---|---|
| 1,120 | 3,896 | 1,209 | 6,225 |
| 76% | 65% | 46% | 62% |
| Male | Female | Total | |
|---|---|---|---|
| No. of employees using leave | 20 | 13 | 33 |
| No. of employees eligible to use leave* | 106 | 13 | 119 |
| Usage rate (rounded to nearest percent) | 19% | 100% | 28% |
| Male | Female | Total | |
|---|---|---|---|
| No. of employees who returned to work from childcare leave during fiscal 2020 | 19 | 3 | 22 |
| No. of employees still employed 12 months after returning to work | 16 | 3 | 19 |
| Percentage | 84% | 100% | 86% |
| Male | Female | Total | |
|---|---|---|---|
| No. of employees who returned to work from childcare leave during fiscal 2021 | 17 | 12 | 29 |
| No. of employees scheduled to return to work | 17 | 12 | 29 |
| Percentage | 100% | 100% | 100% |
| No. of age-limited retirees | 70 |
| No. of these rehired | 53 |
| Percentage | 76% |
| Percentage of employees with disabilities (statutory minimum: 2.3%) | 2.21% |
| Number of senior managers | Senior managers as a share of locally hired employees*1 | Number of locally hired employees*2 | ||
|---|---|---|---|---|
| North America | Male | 13 | 15% | 85 |
| Female | 3 | 10% | 29 | |
| North America subtotal | 16 | 14% | 114 | |
| South America | Male | 43 | 5% | 862 |
| Female | 6 | 7% | 86 | |
| South America subtotal | 49 | 5% | 948 | |
| Europe | Male | 38 | 12% | 327 |
| Female | 8 | 12% | 68 | |
| Europe subtotal | 46 | 12% | 395 | |
| Asia | Male | 106 | 11% | 982 |
| Female | 63 | 14% | 444 | |
| Asia subtotal | 169 | 12% | 1,426 | |
| Total | 280 | 10% | 2,883 | |
Scope of aggregation: Overseas Group companies in which JX Nippon Mining & Metals has 50% or more of their voting rights, directly or indirectly Treatment of seconded employees: Employees seconded from companies outside of survey scope to companies inside of survey scope are counted.
Employees seconded from companies inside of survey scope to companies outside of survey scope are also counted.